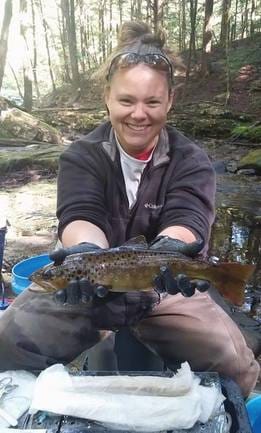
 This year had man large invasive species. Fun props for pictures, but always a little frustrating to find in our native trout streams. This year had man large invasive species. Fun props for pictures, but always a little frustrating to find in our native trout streams. That’s a wrap, folks. In just a few hours the clocks will strike midnight and for the next several weeks I’ll write the incorrect year on every document I sign. This week my computer has been busy running a very long genetic analysis. Notice I say my computer was busy- it took about five minutes for me to start the analysis, but it’s going to take close to two weeks for my computer to churn out the results. And, while new and upgraded, my computer doesn’t have enough oomph for me to run other programs while genetics voodoo happens in the background. Luckily, this was just a trial run. Eventually I’ll have to do a much more extensive analysis that will take even longer to run. I can’t wait. I’m always a little nostalgic on New Year’s Eve. Sure, I could be wishful and think about all my resolutions for 2017. But, let’s be honest. Those are empty promises. I won’t read or vacation more, it’s unlikely I’ll get back to running a 10k a week, and I just don’t have the self-control to be less grumpy. But, 2016 still holds some magic. It’s like a story where the last line is about to be inked and the chapter closed. We survived another one, and there’s no better way to spend this day than retelling the story of 2016 with some pictures I never got to share. 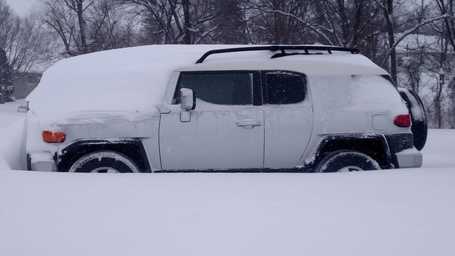 This weekend was a story in it's own. I was snowed in at the fish lab for two days, finally rescued by the maintenance worker at the Science Center. Just me and the fish. This weekend was a story in it's own. I was snowed in at the fish lab for two days, finally rescued by the maintenance worker at the Science Center. Just me and the fish. If I’m telling I story, I think it needs a title, and I think “Wayward Wanderer” captures the essence of 2016 pretty well. I traveled. A lot. And I didn’t have any idea what I was doing most of the time. In January I was finishing a three-month stint in West Virginia where I was collaborating with the USGS Leetown Science Center. Using their experimental stream lab, we were mimicking climate change to see how individual fish differed in their response to rapid increases in stream temperature. I’ll report on those data eventually, but suffice to say fish aren’t swimming robots and do react much differently from one another. We are exploring the data to see if we can figure out if some fish are predictably better than others at tolerating increases to temperature, but it will be awhile before we get that data. While in West Virginia I got snowed in under 43 inches of snow, and then less than a week later I was on a plane headed for Panama City, Panama. I volunteered to help someone else in my lab with their fieldwork, which entailed a six-week trip to the rainforest. I can still remember sitting on the plane, taking off from Richmond, Virginia thinking to myself “what have I got myself into.” 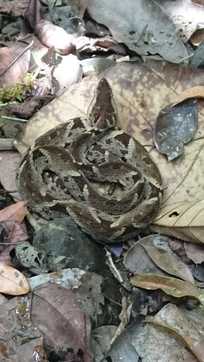 I nearly stepped on this fleur de lance. Although venomous and known to be aggressive, we of course stopped to take pictures. I nearly stepped on this fleur de lance. Although venomous and known to be aggressive, we of course stopped to take pictures. And, to this day, I still don’t really know what I go myself into. I’ve done a lot of field work, but nothing prepared me for that experience. Hiking miles upstream to remote sample sites that few people in this world had ever seen, spying on howler monkeys, getting surprised by boars while collecting data, and of course the snakes. So many snakes. It felt like a real life nature documentary. But, it wasn’t just about the science. I was living along the Panama Canal in a small neighborhood shared among canal workers and a handful of other American scientists who are some of the most intelligent and fun people I’ve ever interacted with. Some days were spent roaming the streets of Panama City trying to remember enough Spanish to order food and find my way around. It was an experience that will no doubt rank among the most memorable times I had while in graduate school. Leaving Panama was bittersweet. After six weeks I had grown a little tired of watching out for dangerous creatures (I came within inches of stepping on a fleur de lance, one of the most venomous snakes in South America, and had a caiman lunge at me from the banks), and I was there at the height of the Zika scare. Someone on my field crew even contracted the disease, and I was working on a species of fish that feeds on mosquito larvae. But, I wasn’t ready to say goodbye to the cultural and social experience. Plus, as long as I was there, I didn’t have to worry about my own pending field season. But, all good things must come to an end and in mid-March I boarded a plane back to the United States, spent an unexpected night with the pigeons of the Newark airport (seriously, Newark, get it together), and then finally got back to State College. I had a little over a month to apply for permits, finalize field sites, organize crews, buy supplies, etc. And, within hours of getting back to the office, we were awarded a grant to work on the gene expression project that is now showing early promising results. So, I also needed to work on my poker face, because I had no idea was I was doing. Like, zero clue. I had never done telemetry or tissue sampling, had no real idea how the fish were going to behave, nor, honestly, did we know if the fish would survive everything we were doing to them. While I had a long list of people that could provide guidance with a few pieces of the puzzle, I felt the pressure to make it work. And I did. Usually. Telemetry officially started in early May and for seven months I felt like I was making it up at I go. But, as normally happens, the things you stress out about the most turn out to be the things that aren’t that difficult. Tagging and sampling? Psss…a breeze. And the fish survived. But, tracking every day? That turned out to be a bit harder. It shouldn’t have been a surprise; field work is a long string of judgement calls that can make or break your entire project. The longer you are in the field, the more of those calls you have to make. No pressure, right? Things like should I wait the rain out, is it really too dark to keep going, are flows too high to wade, should I dig after this tag that seems to be moving in the bank? There’s a fine line between good data collection and stupid data collection, and it takes practice to find it, flirt with it, and ultimately make good calls. While I have a few years under my belts, I always feel guilty and think I could have done more or better. 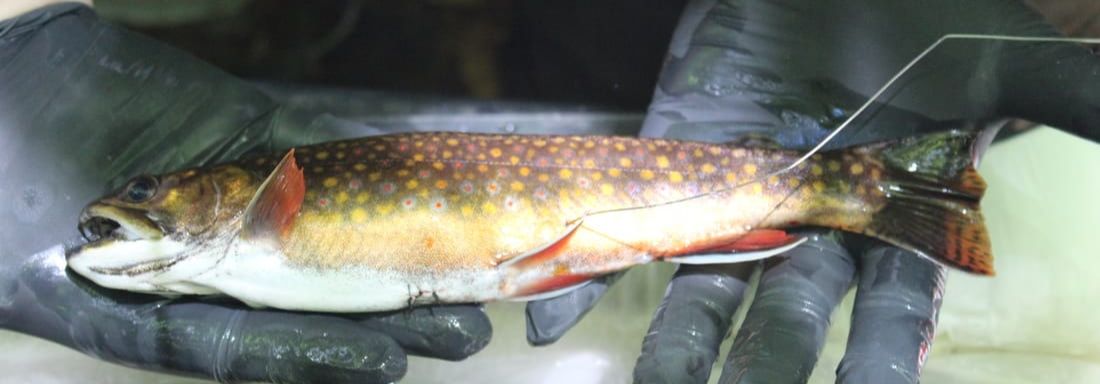 A tagged fish post blood draw. This process was down pact by July. A tagged fish post blood draw. This process was down pact by July.  Broken hand, bruises, and cuts needed stitches, my technician and I lost a little of ourselves to Loyalsock this summer. Broken hand, bruises, and cuts needed stitches, my technician and I lost a little of ourselves to Loyalsock this summer. Ultimately, the biggest hurdle with telemetry was the mental game needed to stay engaged and committed. I walked the exact same streams every day tracking the same fish, often to the same exact spot. Every day. For seven months. But we made it- through dropped tags, harsh weather, wildlife encounters, human encounters, and broken bones. And, I think we got a great dataset. And, now that I’m on the other side of the hurdle, I think back to all the times I was standing beside the stream, tired and wanting to call it a day, but took a deep breath and continued on. Stubbornness is one of my best properties, and it helped that Savannah, Dan, and David kept me entertained. During telemetry I basically lived in Loyalsock where phone service is non-existent and internet is sparse. It made communication difficult, particularly in summer when I was working on publishing a manuscript (which was finally accepted, woohoo!). But, as an upside, it’s a great way to disconnect and motivation to work hard during the day to guarantee an early bedtime. But, I was still largely living out of a suitcase. I think I packed in November 2015, and it wasn’t until September 2016 that I fully unpacked, bought perishables from the grocery store, and enjoyed a full week at my apartment. Even then, I was still making regular trips to Loyalsock, a 4-hour roundtrip commute, so I was still a stranger to the office.  It was a long run. It started in the cold, ran through the hot summer, and ended in sub-zero temperatures. But the end of field season is always bittersweet. It was a long run. It started in the cold, ran through the hot summer, and ended in sub-zero temperatures. But the end of field season is always bittersweet. Telemetry season ended in November, and since then it’s been more travel, only this time to spend holidays in Virginia with my ‘research assistant.’ As the year comes to a close, we are working hard to analyze and publish data for the genetics of brook trout in Loyalsock. Where will we go after that? Your guess is as good as mine.
Finally, perhaps motivated by lack of communication and entertainment this summer, but mostly interactions with interested anglers and citizen scientists, I started this website in June. I didn’t really know what to expect, but I can say the response has been far more receptive than I imagined. In less than six months this website has gotten nearly 17,000 views. Most importantly, it has connected me to people with questions about stream ecology, organizations like Trout Unlimited, news stations, and other academics. I also received an award for scientific communication. So, thanks to all of you for joining me on this ride, and I’m looking forward to seeing where it takes us in 2017. So, did I earn my paycheck this year?
0 Comments
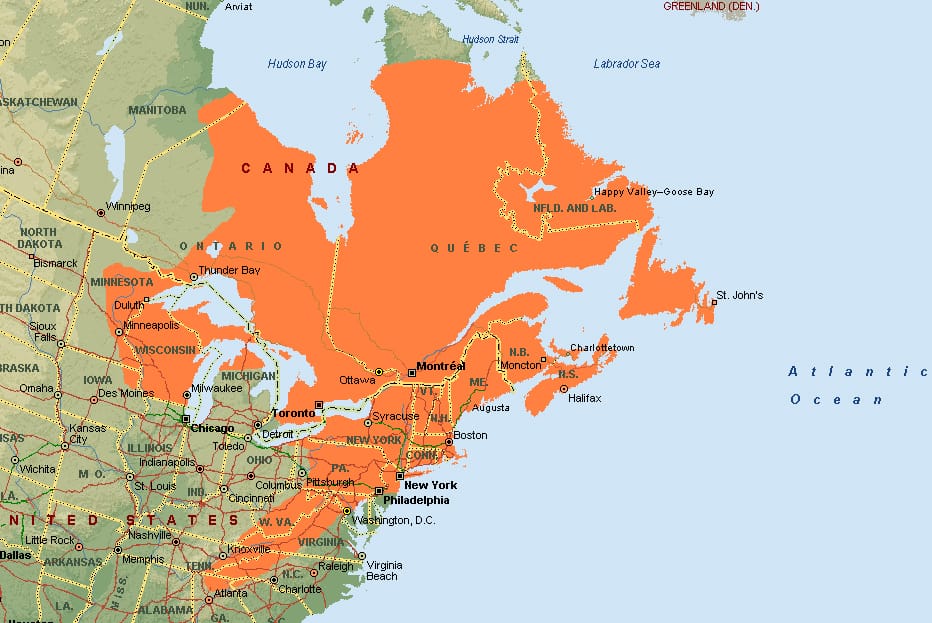 The native range of brook trout shown in orange. How do you manage a species that covers multiple states and countries? The native range of brook trout shown in orange. How do you manage a species that covers multiple states and countries? ^ Pun intended Last week we talked about how genetics can aid in the management of threated fish species by quantifying genetic diversity (remember, the more the better) and identifying isolated populations (again, recall that population isolation is usually bad, but read last week’s post for a contrary example). But, genetic studies can be important for management of even the most common fish species by helping identify the right scale of conservation and management efforts. What does ‘scale of management efforts’ mean? Let’s think about brook trout. Though sometimes locally common, brook trout is a species of considerable concern throughout its native range extending from Maine to Georgia. In just about every state on the east coast fisheries managers are tasked with creating a management plan that accomplishes two fundamental goals: secure long-term population persistence in the face of climate change, invasive species, and habitat loss AND increase angling opportunities. If those goals seem in opposition, welcome to fisheries management. Conservation and recreation sometimes don’t go hand in hand. But, I digress… So, plans are created. But, how much area should each plan cover? The entire range of brook trout? It is, after all, the same species. But, that doesn’t really make sense. Threats to brook trout are different in Maine than they are in Georgia (Georgia is a lot hotter, for starters). Plus, different states receive funding from different locations, have different levels of involvement from citizen groups, and have different levels of angling pressure. So, to make one really big management plan that encompasses the entire range of brook trout and all possible threats would not be very usable to local managers. Plus,depending on who you talk to, some believe brook trout are actually multiple species along the east coast. So, it needs to be more fine-tuned that than. What about a brook trout management plan unique to each state? This gets closer. Across a state you would expect climate-related threats to be reasonably similar and funding sources to be shared within state boundaries. But, this scale is also problematic. Streams can cross state boundaries, there’s different interest in cold and warmwater fisheries across the state, and land use (and threats related to changes to land use) are different across the state. So, we still need something smaller. Okay, how about a management plan for every individual stream? While this would definitely provide a lot of protection to localized threats, it is only practical for the largest streams and rivers. Biologists haven’t even surveyed many small headwaters, so we don’t know if they contain brook trout, or what the threats may be. So, to inventory the threats and population sizes of each stream and then create and implement a plan of action is not possible. Even if we did make those plans, a single fisheries manager is often tasked with covering a large chunk of the state and so they couldn’t possibly enforce a management plan that is unique to each and every stream. Further, it compartmentalizes individual streams when we need to focus on connectivity between waterways. 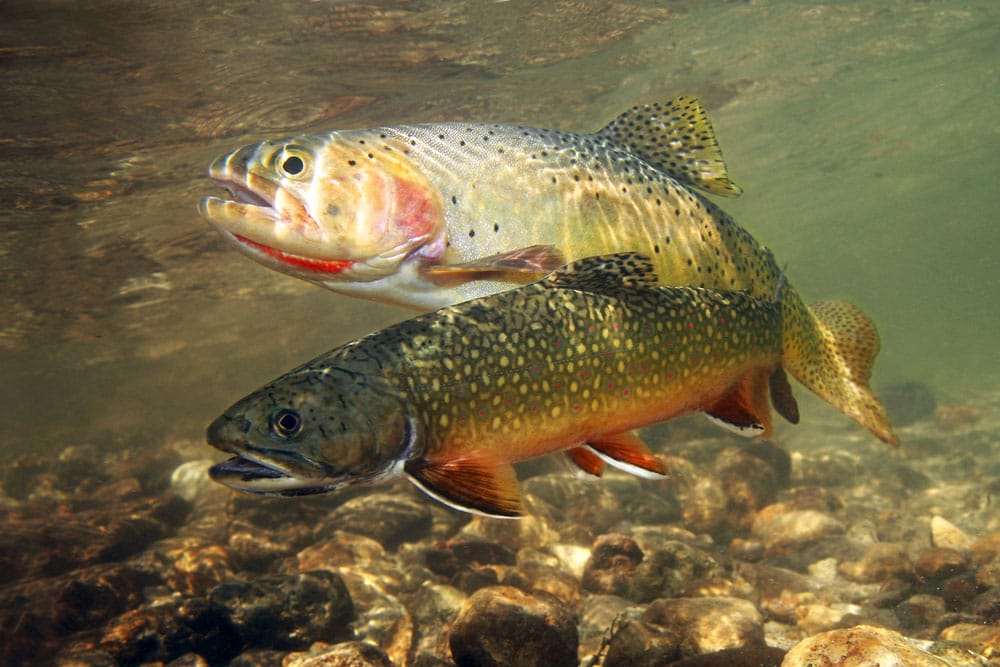 Different states, and even different regions within a state, have very different attitudes towards stocking and nonnative trout. Yet another reason management plans covering a lot of turf would be unreasonable. 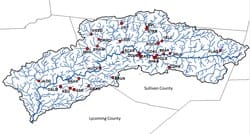 Every red dot on this map is a population in my genetics study. While data analysis is ongoing, we suspect each population will be genetically distinct from one another. Every red dot on this map is a population in my genetics study. While data analysis is ongoing, we suspect each population will be genetically distinct from one another. So, what is the solution? The truth is there’s often no easy answer, and it often depends on the ecology of the species. A highly mobile fish can, and should, be managed at larger scales than a smaller fish that moves shorter distances. But, there are trade-offs. At larger scales you may miss some of the local problems, and at smaller scales you may be unable to manage the entire range of the species effectively and not pay attention to process that happen at larger scales. But, for most species and for many managers, the easiest balance of scales is found at the unit of a watershed. And, ‘watershed’ can be somewhat ambiguous because every small stream has its own watershed. But, when I say watershed, I generally mean the area of land that is drained by a reasonably large river. Larger watersheds represent an area of land that is easy to identify and has similar threats and recreational uses. Further, species composition within a watershed is likely to vary little, such that a watershed with brook trout is unlikely to also be a trophy largemouth bass fishery (because largemouth are a warmwater species). But, while watersheds can make the most practical sense, are they biologically the most appropriate? For highly mobile species, they probably are. However, while brook trout are mobile, we also know that populations tend to quickly become genetically distinct. Several studies have found that brook trout populations from neighboring streams often show genetic separation, even in the absence of a barrier. This would indicate to us that nearly every stream in a brook trout watershed is its own independent unit. And, if you’re following my studies in Loyalsock Creek, preliminary results suggest that every population that I sampled is genetically distinct from one another. So, should we let genes dictate our management efforts and manage each genetically distinct population? Maybe, but, again, it really isn’t feasible and perhaps not necessary. But, what we can do is factor that information into our watershed’s management plan. As we learned from our last post, being genetically distinct isn’t a guarantee that the population is completely isolated, or at risk of collapse. It just means there are not that many fish moving in and out of the population. And, we are quantifying genetic similarity from microsatellites, which are neutral genetic markers and therefor do not suggest that there are specific, important genes absent or present in some populations. So, there’s no reason to suggest that genetic distinction is indicative of reduced long-term survival (there are other metrics we need to look at to start making inferences about how genetically “safe” a population is…a post for later). So what does it tell us? The fact that populations are genetically distinct could suggest that brook trout are locally adapting to the environment at small spatial scales. In the future, hatchery stocking and translocations from one population to another are going to become increasingly popular tools for managing brook trout However, stocking populations that are genetically incompatible with the environment can either cause immediate mortality or lead to outbreeding depression, which occurs when a native individual mates with a foreign (be it stocked or a migrant) individual, and the resulting offspring have genotypes that make them maladapted to local conditions. So, considering local adaptation is necessary for ensuring successful management outcomes. The fact that even neighboring populations of brook trout are prone to becoming genetically distinct also highlights the importance of maintaining connectivity. The reality is that few trout move, and then reproduce, outside their native streams. But, in this case, the minority of the population takes high priority. It may not result in two populations becoming genetically similarit, but the handful of trout that do move and reproduce elsewhere are increasing genetic diversity at the new site. Ultimately, increased genetic diversity is what we want to see as it increasing resilience to habitat loss. It’s nature’s own management plan! So, for brook trout, we can’t let genetics decide our management scale, but we can use it to improve our management practices and help us better understand the ecology of the species. This may be my last post of 2016, so next time we'll take a look back at the year that was. Until then, I think I need to watch Home Alone for the upteenth time. Happy holidays to all!  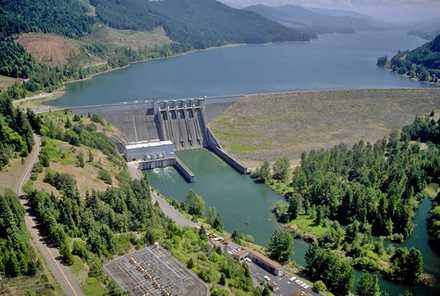 Want to disconnect fish populations, decrease genetic diversity, and increase risk of extirpation? Dams are a good way to achieve those goals. Want to disconnect fish populations, decrease genetic diversity, and increase risk of extirpation? Dams are a good way to achieve those goals. Last week I broke down some of the nuts and bolts behind genetics studies, explaining what a microsatellite is and why they are useful for genetics studies. If that seemed confusing or uninteresting, stick with me! That information, while important and useful, isn’t required to understand what I’m doing. What is important is an appreciation that genetics can tell us a lot about how we should manage our fish populations, and for the next several posts I’ll be delving into some of the reasons genetics studies are so informative. Let’s start with a thought exercise. You are a fish manager tasked with creating a conservation plan for a threatened fish species that is found in only one river in the United States. Populations of this species are currently isolated from one another by dams, and habitat is significantly reduced from historic conditions. Generally speaking, biologist cringe when they hear this, particularly at the phase ‘population isolation.’ Higher connectivity among populations generally means higher genetic diversity, which usually results in healthier, more stable populations (we’ll dive into those details later…for now just trust me). So, your gut reaction to this problem might seem easy - remove the dams, restore the habitat. But, wait! Before you say ‘down with the dams!’, you need to consider nonnative species. Restoring connectivity for native fishes will also increase connectivity among populations of nonnative species, thereby improving the health of their populations as well. It will also likely allow nonnative species to invade new habitats were they could compete with, and potentially extirpate, populations of the threatened species you are fighting to restore. So what do you do? Do you try to improve connectivity knowing it could increase the abundance of nonnative fish, but potentially improve health of native fish? Or, do you leave things as-is knowing native fish population may be declining, but at least they are protected from nonnative species? Before you make a decision, you may decide you need a better picture of how healthy native fish populations are. 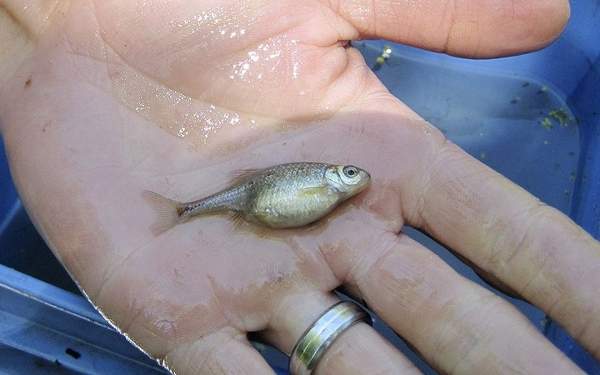 Introducing the star of the show...the Oregon chub! Once endangered, not threatened, and occurring only in the Willamette River in Oregon. This is a scenario often faced in fisheries management, and one that genetics can help resolve. And, this is exactly what scientists out west did with populations of Oregon chub, a fairly small minnow species that is only found in the Willamette River in Oregon (to read the full paper, click here). Construction of flood control dams and introduction of nonnative species, particularly sunfish and catfish, severally reduced populations and restricted them to isolated areas within the river. Through significant effort, populations of Oregon chub have been showing signs of improvement, and the species was even downgraded from endangered to threatened on the Endangered Species Act. But, populations size isn’t always indicative of long-term stability (as we’ll discuss below), and appropriate next steps for management were uncertain. Enter genetics. Biologists collected tissue samples (in the form of a small portion of the caudal fin, which is not harmful and grows back) and ran analyses to determine how genetically different each population was from one another and how genetically stable each population was. The result? Though most populations of Oregon chub were isolated from one another and were genetically different, most still maintained high genetic diversity. And, most populations still had a lot of adults reproducing, which indicates genetic diversity will likely remain high into the future. So, though genetics are not a definitive measure of fish health, the study did indicate that most populations were likely healthy and stable into the near future. 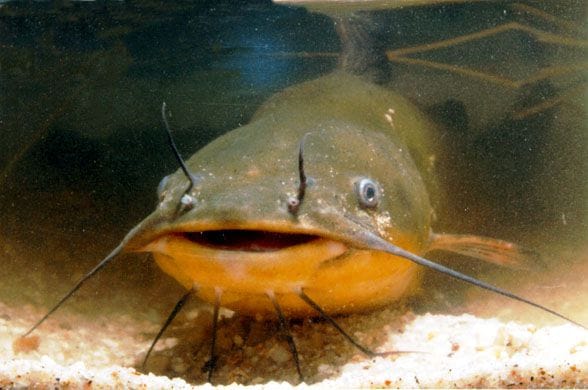 Nonnative fish such as sunfish and bullhead catfishes are some of the biggest threats to native Oregon chub populations. Removal of dams and restoring of connectivity to Oregon chubs would likely increase abundance of these nonnative fishes. So, as a manager, you let out a sigh of relief. You dodged a huge bullet. Restoring population connectivity, which seems like it’s the right thing to do, would have probably been one of the worst things you could have done. In addition to the cost, benefits to Oregon chub would have been negated by the introduction of nonnative fish which would have reduced population sizes. And, you wouldn’t have known any of that if it wasn’t for genetics suggesting current populations were healthy.
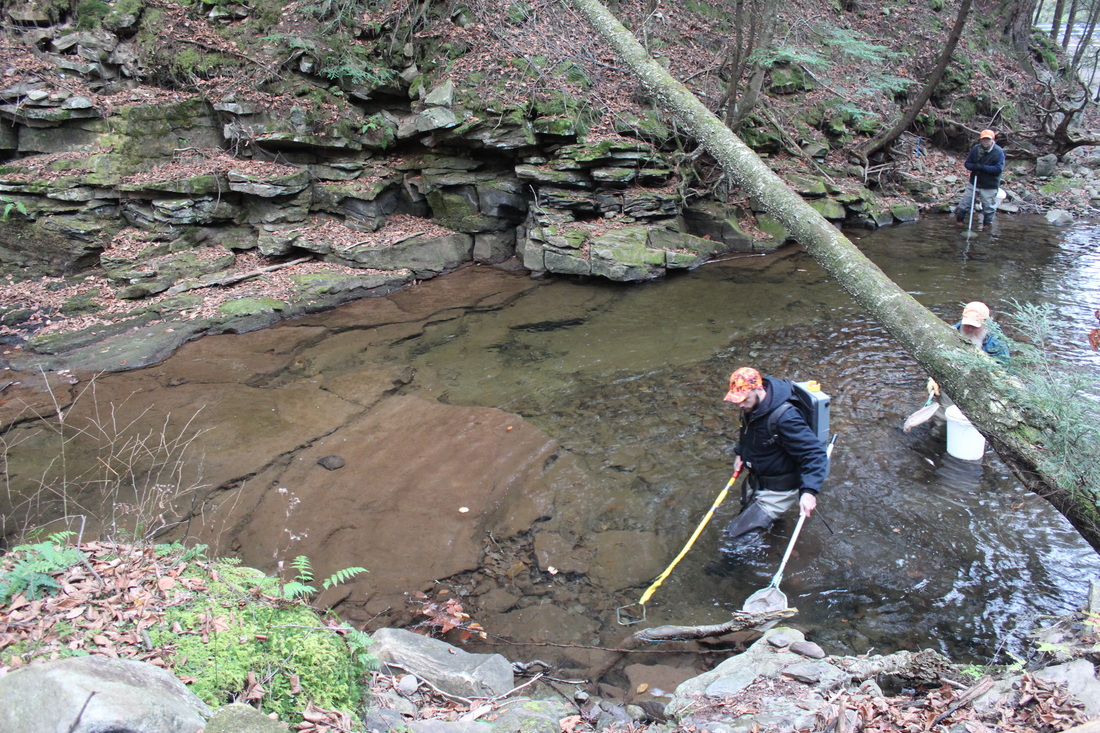
The study also highlighted another important fact. Numbers can be deceiving, and a population that has a lot of individuals isn’t necessarily healthy. One of the largest populations of Oregon chub had the lowest genetic diversity. Why does this matter? Well, one of the recovery strategies for Oregon chub involves creating new populations by taking individuals from one population and putting them in an area of river with good habitat that is currently unoccupied (a practice we call “translocating”). Normally, you take individuals from strong, stable populations, and without genetics you assume population size is a proxy for health. But, that’s not always the case, and translocating individuals from an unhealthy population with low genetic diversity could be setting them up to fail in their new environment. Genetics also helps identify the correct scale of management. For example, should each stream be managed differently. What about river? Or entire watersheds? Maybe the state of Pennsylvania? You want to manage the largest area possible because it’s cost effective and easier. But, threats affect fish differently at different locations. And, these affects are usually species-specific. So, there’s no easy answer as to what the scale of fisheries management should be, but genetics can help guide the choice. But, I’ll save that topic for next time as it directly relates to trout management and some of the results we are finding in our studies.  A throwback photo from last sampling season where we waded across Loyalsock Creek in high water to get tissue samples from an isolated population. A throwback photo from last sampling season where we waded across Loyalsock Creek in high water to get tissue samples from an isolated population. After field work ended the question was ‘now what?’ I have a lot of datasets for several different projects, and I needed to figure out which to tackle first. But, despite exciting observations at the end of the telemetry season, I can’t start there. It’s a really messy dataset that’s going to require a lot of tinkering, input from collaborators, and there are some plans for more data collecting in the spring. I ultimately decided to dust off a dataset from last year that was collected to determine the genetic structure of brook trout populations across the Loyalsock Creek watershed. But, I hesitated to start here. It’s no secret that I struggle with even the most fundamental concepts in genetics. I have a hard time understanding things I can’t visualize, and I managed to skirt my way around taking genetics classes as an undergraduate. But, the last few years I have grown to appreciate the questions you can answer about trout conservation through genetic studies. So, through a lot of hand holding from my friends who study genetics and our collaborators at the U.S. Fish and Wildlife Service, I am very slowly getting there. One of the downfalls with genetics is that the topic can very quickly become technical and stray beyond the average person’s interest and understanding. But, that’s where my ignorance actually comes in handy. I don’t know enough to make the conversation technical! For the next few months I’ll be working on analyzing genetics data, and along the way I’ll try to breakdown all the concepts and terminology in a way that is both understandable and (hopefully) interesting. For starters, let me go back. I am studying the population genetic structure of brook trout across the Loyalsock Creek watershed. What does that mean? Basically, I’m trying to see how genetically similar brook trout are from different locations around the watershed. We would expect that populations that are close to one another would be more similar than populations that are further away. This is because it’s more common for fish to move to, and then reproduce in, a neighboring stream than to make a long-distance movement to a stream many miles away. This is particularly true for species like brook trout which, compared to other species, don’t move very far. Trout also live in cold, headwater streams and warmer mainstem rivers act as barriers to movement, thereby further limiting exchange of individuals among populations. There’s many ways to measure genetic diversity, but we are doing it by looking at differences in sections of DNA called microsatellites. To explain this concept a little further (mostly to myself...the visuals help), I often show the diagram below. Basically, every tissue in an organism’s body is made up of cells. Floating around inside the nucleus of those cells are chromosomes, and every chromosome contains thousands of genes. A gene is made of DNA, and DNA codes for proteins that ultimately produce all features of an organism. Put another way, genes are like instruction manuals, and DNA the step-by-step instructions for how to assemble, in this case, a trout. 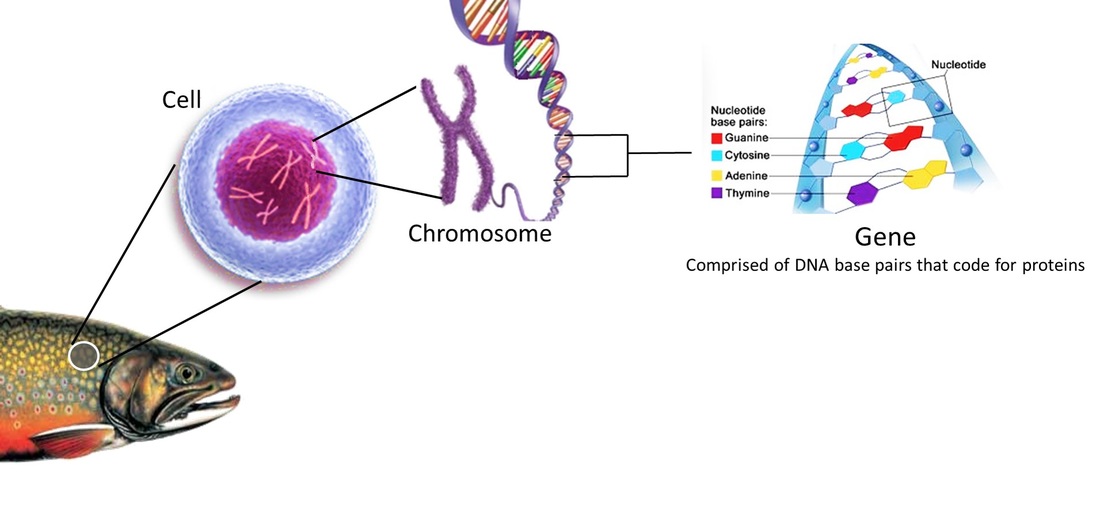 A visual breakdown of the some of the important terms used when talking about genetics studies. The DNA inside genes is made up of base pairs (some of you may remember that there are four base pairs, adenine (A), cytosine (C), guanine (G), thymine (T)). While most of these base pairs code for specific proteins (for example, the base pair string of UCA codes for the protein ‘serine’), there are some sections of DNA that are “silent” and serve almost no biological function. One such case are sections of DNA known as microsatellites, which are sequences of 2-5 base pairs that are highly repetitive and do not code for a protein. Microsatellites are powerful in population genetics studies for many reasons. First, because they do not code for a specific protein or trait, they are largely conserved in populations. This is important because if we were analyzing coding regions of DNA we wouldn’t know if absence of the DNA region was because of genetic isolation or because the environment was selecting against the trait that was being produce and therefor deleting it from the population. The other reason microsatellites are useful is because they are prone to mutating. Again, because microsatellites do not have a functional purpose, these mutations are not harmful. But, these mutations work to give each population its own unique “signature” which we can track around the watershed as fish move around. 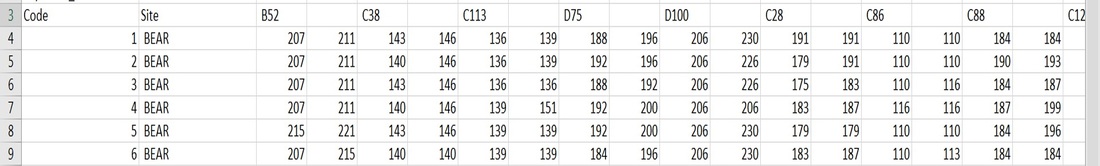 Just a hint of what this dataset looks like. You can see the genotypes for 6 fish from Bear Run at eight of the 12 microsatellite loci we are analyzing. Just a hint of what this dataset looks like. You can see the genotypes for 6 fish from Bear Run at eight of the 12 microsatellite loci we are analyzing. The location of a microsatellite on a gene is referred to as a ‘locus,’ and we analyze 12 different microsatellite loci to make inferences about population genetic diversity. Basically, we look across all loci to see how different individuals are within a population, and compare that to how different individuals are across all populations. Thankfully there are software programs to do this.
If you’re curious, below is what this data looks like in real life. Every row on that spreadsheet represents an individual, and the columns represent the ‘genotype,’ or genetic composition, for each microsatellite. In this case, the genotype represents the number of times the base pair sequences repeats. So, for example, the microsatellite loci B52, which is a base pair sequence of GCGT, is repeated 207 times in the first individual on that spreadsheet. You'll also see that there are two numbers for each loci because trout are diploid, meaning they get one copy of the gene from their mother and one copy from their father (just like humans). And, if you quickly glance down the spreadsheet, you see a lot of similarities because all of those fish are from the same population. I’ve spent the last few days trying to run some summary statistics to describe the genetic diversity of all 28 samples sites and determine how similar each site is to one another. I’ll report some of those results in the coming weeks but, for now, don’t worry if all of that seemed confusing. Just remember- we study sections of DNA called microsatellites, and the more similar the microsatellites are the more genetically similar two fish, or two populations, are. That’s not so bad, is it? 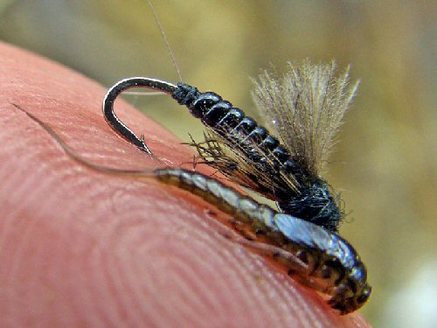 Matching one of the stonefly hatches, one of the most important hatches for many trout streams. Matching one of the stonefly hatches, one of the most important hatches for many trout streams.
Today it might be snowing. And the days may still be getting shorter. But, before you know it spring will be here and the forest will come back to life. And, when it does, trout anglers will turn into entomologist and the phrase “what’s hatching” will be heard at tackle shops across the nation
“Match the hatch” is a common phrase among trout anglers used to describe the act of matching artificial lures to aquatic insects that are currently hatching from their juvenile into adult stages. When insects are hatching they are abundant, and so the probability of one floating downstream and being seen by a trout is fairly high. But, trout are picky eaters. They develop a search image for one or two species of insects and become hyper-focused on eating only those species to the exclusion of all other food sources. Search images are helpful because it helps fish quickly tease apart an insect from little pieces of debris or rocks that could potentially look like food as it floats downstream. It’s kind of like putting together a jigsaw puzzle. There could be a pile of pieces in front of you that go together, but if you’ve developed a search image for edge pieces you’ll look past the other pieces for a long time. 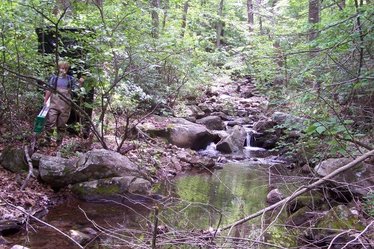 We worked at Fridley Run just north of Harrisonburg, VA. It's a small stream with populations recovering from issue related to low pH. We worked at Fridley Run just north of Harrisonburg, VA. It's a small stream with populations recovering from issue related to low pH.
Search images can be helpful because it quickly allows fish to categorize floating objects as ‘food’ or ‘not food’. But, they can also be problematic because hatches don’t last for very long. Sometimes by the time a fish has developed a good search image the hatch is nearly over. If that happens, the fish has a search image for an insect that is no longer common, and the fish will wait to see that specific species float by while allowing many other insects to pass by without being consumed.
More problematic is that search images can take a long time to form. It’s a long trial and error process where the fish has to keep trying to eat a lot of things that look similar to the hatching insect before it hones in on the exact characteristics that make the insect look different than a piece of stick or a leaf. Search images where the first thing that got me interested in studying trout. At the start it seemed a little silly and a waste of time for a trout to need a search image. But, if you think about it, it makes a lot of sense. If a trout’s is willing to eat everything and has a search image that is too broad, then it will spend a lot of time chasing down little sticks or, worse yet, eat something potentially toxic. But, if their search image is too narrow, it will not eat enough to survive. It’s an interesting problem to have. More interesting was that, at the time, no one had studied specifically how trout develop search images. Yes, at some level it’s a trial and error process. But, trout live in pools with other trout. And, they have eyes capable of watching what those other trout do. So, my advisor had a hunch. Perhaps they learn search images socially. That is, they watch other fish test out food of various shapes and sizes and that helps cut down the time it takes for a fish to develop a search image. That was the theory we tested in 2008 in what still remains my favorite study I’ve ever done (a link to the publication that resulted can be found below). We started by going out and electrofishing trout from a small stream in Virginia. But, we had a bit of a unique problem. To track search image development, we needed to not only monitor fish behavior, but be able to trace the behavior of each individual over time. In short, we needed some sort of external that had unique identification for each fish and could be seen from about 50ft away from the stream bank. 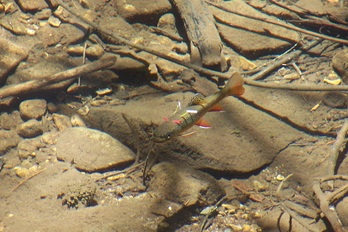 Ribbon tags make it possible to document individual fish behavior during streambank observations of behavior. Ribbon tags make it possible to document individual fish behavior during streambank observations of behavior.
The solution was ribbon tags- small pieces of plastic glued to a needed. After the fish is anesthetized, you thread the needle under the top layer of skin, out through the other side, and then tear the needle off the plastic tag. The plastic remains under the fish’s skin (and don’t worry, these tags fall out a few months after they are put in). So, now we had about a hundred fish in the stream swimming around with a little extra bling.
We then installed feeders in two pools that had a lot of fish. The idea was to train some fish to develop a search image and then move these trained fish to new pools to see if they helped new, untrained fish develop search images. The feeders were a series of PVC pipes, a small, battery-operated toy motor, and a photocell. Every 5 minutes the feeder would turn on, spin a little brush in the PVC tube, and out would come some mealworms. The mealworms were their own story. They came in a can and were intended to be fed to reptiles. And, relative to hatching insects, these mealworms were king size candy bar- high in fat, calories, and exactly what a starving fish wants. But, there was a problem. The worms were fairly moist, and so when they hit the water they would sink. The majority of trout diet is made up of floating insects, and so we needed these mealworms to float. So, out came the frying pan and camp stove, and we fried the mealworms to a crispy golden brown (in what may or may not have been the same skillet we cooked dinner in). So, with fish tagged and feeders in place we sat and watched. And every time the feeder went off we noted the behavior of every fish in the pool. And, for a long time, their behavior was to do nothing. Feeder goes off, worms float downstream (often right over top the trout), no one eats them. Repeat. For days. And, we did these observations from about 7am-7pm. 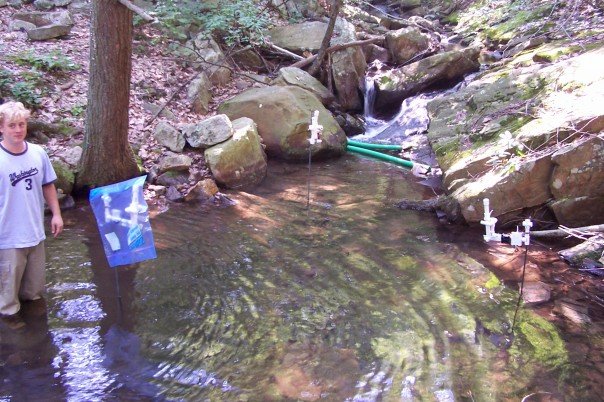
Here we have three feeders installed in a pool we were training fish. Here's a good place to note that the entire budget for this project was $500.
But, after a few days things started to change. It started with one brave fish finally eating the worm, but then spitting it up. There was clearly some hesitation. Then a few days later, the fish took the worm swallowed. After that the fish knew it had saddled up to a buffet and it would sit at the feeder anxiously awaiting the next round. In total, it took about 14 days for fish to develop search images. Remember that number.
Below is a video of what this whole process looks like. Look carefully for the tagged fish (his color code is blue-blue-blue) sitting on the far right of the screen. He is sitting in the current waiting for the feeder (the large blue bag) to release a worm, which happens around the 50-second mark. Continue watching after the tagged fish feeds and you'll see him try to fight with another untagged fish. 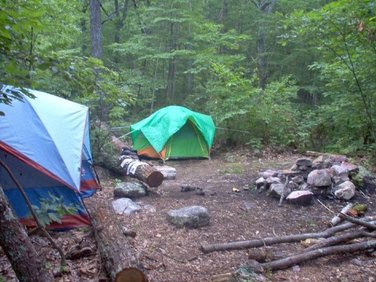 Home sweet home for two summers during my undergraduate studies. Thankfully trout learned their search images quickly, because that tent life is a little overrated after a few weeks. Home sweet home for two summers during my undergraduate studies. Thankfully trout learned their search images quickly, because that tent life is a little overrated after a few weeks.
After these fish were trained, we electrofished out of their home pools and moved them to new pools throughout the study area and installed feeders in these new pools. Here is where we crossed and fingers and hoped. How long would it take a naïve fish to develop a search image for mealworms if they could watch another fish that already had a search image?
Hours. Maybe less. We didn’t immediately start observations, but by the time we did untrained fish were already consuming mealworms. To put it another way. Without social learning it takes 14 days to develop a search image. With social learning it takes less than a day. Why does that matter? Trout basically starve during summer. They need to be able to quickly switch their search images in order to consume the most calories possible, and social learning is a mechanism they have evolved to use to speed the process up as fast as possible. Does this study help in trout conservation? Probably not. But, it does showcase how complex the species is socially and intellectually. When asked to give public seminars I often present on this study for several reasons. First, because it’s so unique and different from typical fish research. And, second, because it’s entertaining and, without fail, the audience really connects with the story. So, maybe this research does help in trout conservation. Not with directly improving population health, but in helping from empathetic connections with what is not the most charismatic of animals. And, now trout anglers can blame social learning when they don’t get a bite. To read more about this study, click here.  I thought for sure I got a picture of just the tree, but they all seem to contain a mastiff in them. I thought for sure I got a picture of just the tree, but they all seem to contain a mastiff in them. Thanksgiving came and went. The Christmas decorations are up and making the house annoyingly festive. Now it’s time to take a deep breath and prepare for the chaos that comes before the next long holiday. Not sure why, but it always seems like early December has the most deadlines. First up- The Troutlook might be expanding. Penn State offers a pretty lucrative deal where undergraduates can apply for a semester-long research fellowship. It starts with a small research proposal - background information, proposed methods, significance of results, etc.- that offers a nice introduction to what the “professionals” have to do when trying to convince a granting agency to give us money. If funded, the student gets paid about $1,700 and gets three academic credits to conduct research during the semester. It’s a really great gig. This semester I’ve had several undergraduates approach me about opportunities to volunteer in the field or help analyze data (lesson one: volunteering with a grad student is a great way to get experience and put your foot in the door). Penn State has a fairly small fisheries program, and so one goal I have anytime a student joins me is to give them career advice and answer questions they have about jobs and grad school (lesson two: volunteer for everything, you’ll always learn something). I had two students in particular that stuck with me despite me ignoring their many, many attempts to volunteer (lesson three: persistence- One of my favorite quotes that summarizes grad school is “I have no special skills, I am only unreasonably persistent”). I started working with them around the same time I heard about Penn State’s fellowship program, and it made perfect sense for both of them to submit a fellowship proposal. Those are due this week, and I’m optimistic that we may be adding some undergraduates to the team. Fingers crossed! I spent some time this week editing the first draft of their proposals. Of course both proposals are for research related to brook trout and climate change, and the proposal guidelines have tight word restrictions. When pressed with word limits, a great strategy is to floor the reader with a quick statistic that paints a harrowing picture about your subject at hand. No fancy numbers, no long descriptions, no background of fish required. I found it in a paper that Seth Wenger and his colleagues wrote in 2011: Nearly 80% of brook trout habitat will be lost to climate change. 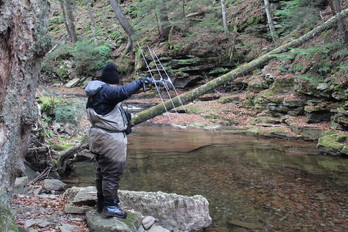 Only for the trout will I wave a TV antenna around the stream in sub-freezing temperatures. Only for the trout will I wave a TV antenna around the stream in sub-freezing temperatures. Why so high? Yes, stream temperatures are rising above brook trout thermal tolerance. We all knew that. But, that’s not the only aspect of climate change that will affect brook trout. We spend so much time focusing on temperature that we often forget about other aspects of climate. For example, more rain and less snow will lead to increased winter stream flows. For fall-spawning brook trout, higher flows during winter will results in decreased egg survival and accelerate population loss. The negative effects of increased stream temperatures and higher winter flows may also be accelerated were there are multiple trout species, such and brook and brown, that are competing for the same resource, or increased watershed development that may degrade habitat or fragment populations.
But, 80%. Wow. These results represent a model for brook trout populations out west where they are nonnative. So, perhaps they aren’t directly transferable to native brook trout populations of the east coast. But, in the west streams are generally colder and brook trout populations larger and more robust. So, I can only guess what a similar model for east coast populations would look, but I feel fairly confident in saying the numbers wouldn’t be pretty. Also disheartening is that these projections are for 2080. Perhaps I was just being naïve, but I used to think that climate projections were so far in the distance that we didn’t have to worry. Surely we would fix these problems by then. And, 60 years may still seem fairly distant. But, it suddenly seems like the clock is ticking. Our time to fix this problem is running out. Every generation of trout counts. Every year that we don’t make progress is another year closer to extinction. This is why I do the research I do. At times it seems like my ideas are grasping at straws with more oddball ideas. And, maybe they are. But, if we are to save trout, we need to do more than model their numbers, stock more fish, and plant more trees. Those are all worthwhile endeavors, but we need more. We need something different, something new. Something that very soon can start tipping the odds in favor of brook trout. And, it all starts with an oddball idea…. I made it- 168 days after I released the first tagged trout back to Loyalsock, I am hanging my waders up to dry. Telemetry season 2016 is over. And, it a good one. Here are a few quick numbers to describe the last 6 months.
 Three members of the army, including two volunteers. I think volunteering to lift buckets in freezing temperatures is a sign of insanity, but I can't thank them enough. 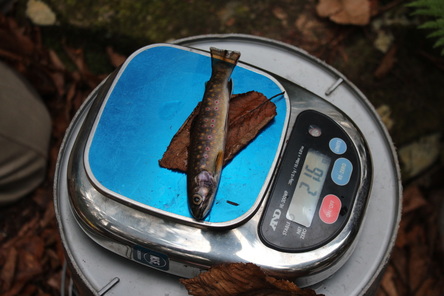 The lack of adult trout may have made me a little desperate on which fish I was willing to collect tissue from. Thankfully by now I'm fairly good at drawing blood, so even the small fish survive the process unharmed. The lack of adult trout may have made me a little desperate on which fish I was willing to collect tissue from. Thankfully by now I'm fairly good at drawing blood, so even the small fish survive the process unharmed. What’s on the docket now? First off, a lot of sleep. Then, a lot of unanswered emails. “I’m in the field” has been a great way of avoiding a lot of requests and obligations. Thankfully most people emailing me understand the chaos of field season, but I can no longer play that card.
After that, it’s time to start thinking about how to analyze all the data. In addition to the telemetry study I have about three other projects that are in need of attention. The data for all of them are collected, the results fairly clear and predictable, but it’s time to start making them more official and getting them ready to publish. For example, I can tell you a lot of great information from what I saw in the field. But, rather than saying “the fish moved,” I need to relate movement patterns to things like stream flow, fish size, and hopefully genetics. To do that, I also first have to clean all the data- fix bad GPS points, download temperature data, make sure everything is recorded correctly, etc. A lot of mind numbing days are ahead. But, sneak peek- the fish moved. And the most surprising thing, at least to me, is how many fish moved to Loyalsock after spawning. We thought it might happen, but I was thinking it would be a smaller percentage than what we found. During November sampling we really struggled to find adult brook trout, while in September they were plentiful. While I’m looking forward to spending more time at the office and having some resemblance of a normal schedule back, it won’t take long for me to miss Loyalsock. While the bulk of field work for my degree is now complete, we have discussed the possibility of sampling more in the spring and summer. So, hopefully it won’t be too long before I’m back. For now, Happy Thanksgiving! And if you’re fishing Loyalsock, keep an eye out for my antennas. My babies are on their own until spring. 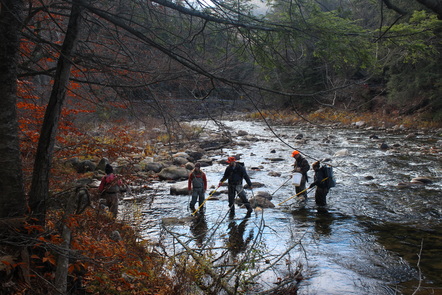 Searching for "the trout" of 2016. Now that I know they are in Loyalsock, it's going to be interesting to see where they go. Searching for "the trout" of 2016. Now that I know they are in Loyalsock, it's going to be interesting to see where they go. In 2014 it was a hunch. In 2015 it seemed like a long shot. In August it was wishful thinking. In September it seemed possible. But today it is without a doubt confirmed. Brook trout use Loyalsock Creek as overwintering habitat. In my post last week I hinted that this was probably the case. There were a few tags that suddenly appeared in the mainstem shortly after what I had guessed was peak spawning season. But, we couldn’t be sure. There’s always a question of whether a dropped tag floated downstream. And, even with some tags entering the mainstem and going upstream, it’s always possible that they were gobbled up by a bird. But, there’s no question about it now. This week we’ve been doing the final round of 2016 tissue collections and finished a little early on Thursday. On a wing and prayer, with daylight dwindling, I sent the crew to an area on the mainstem Loyalsock that had a few tags and was shallow enough to wade through. I was hoping to maybe move the tags around, which would confirm that it was in a fish, and with any luck actually capture a brook trout. But, even if a trout was there, the probability of catching it was small. Backpack shockers are intended for small streams where you can push fish into habitats they can’t escape. In larger waters, the fish feel a little tingle and start running. And, walking in Loyalsock is like sliding around on greased bowling balls. But, I had to try. So, Dan and I hoisted on the backpacks and started shocking. Chubs, madtoms, smallmouth bass. All signs of a cool water fishery and not what you want to see in trout waters. We shocked past where the receiver said the tag was, but it didn’t move. It started to seem likely that it was a drop. We fine-tuned the signal to a large rock and Dan started shocking all around it. I stood on the side anxiously awaiting the outcome and prepared for disappointment. Standing there, I see a white mass come out from under the rock and held my breath in excitement waiting for Dan to identify his catch. Sure enough, not only was it a brook trout, but it was tagged fish 38.16. Success! And, after searching for more tags, we ended up catching a much smaller, untagged brook trout. They are there, and they are fairly abundant. 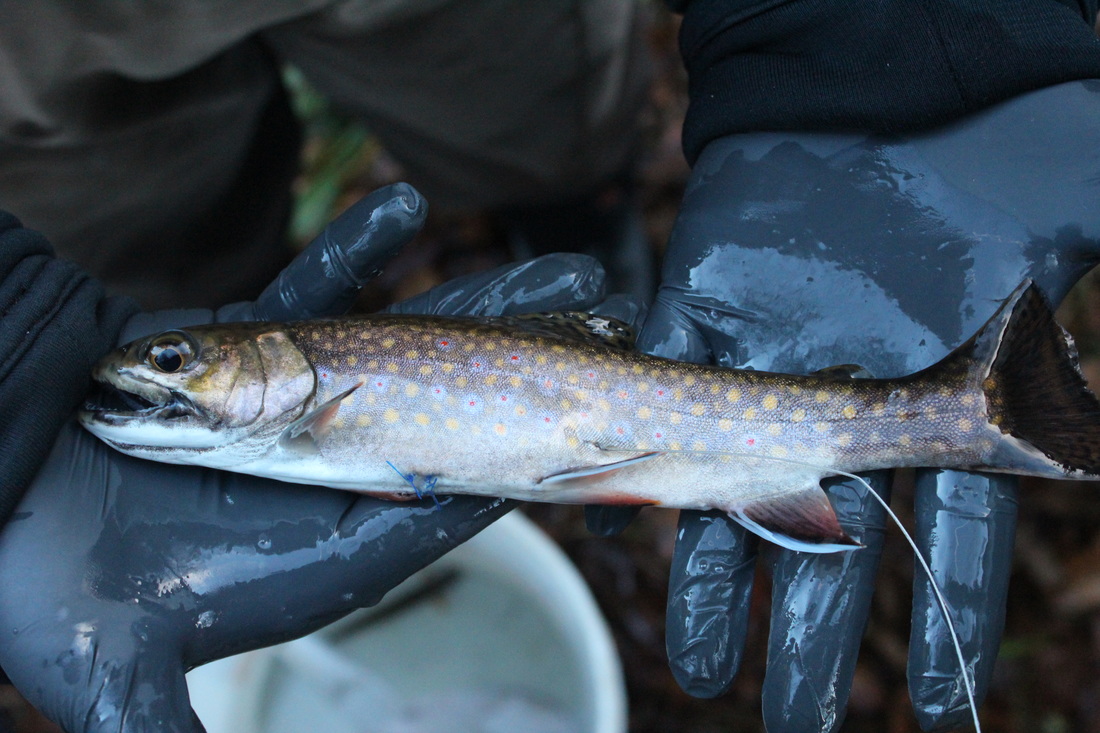 So hello to 38.16, the first confirmed fish to use Loyalsock as overwintering habitat. With a movement distance best measured in miles, this fish fought hard to find larger waters. 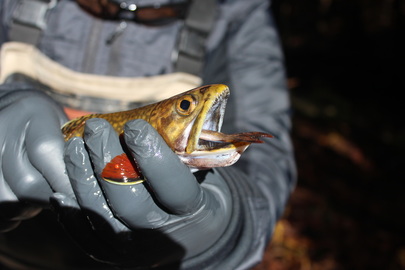 When the going get tough, just eat your competitors. When the going get tough, just eat your competitors. That fish was originally tagged in East Branch in September. In the early weeks of fall tracking we saw it swimming in a shallow pool several times, likely preparing to spawn. And then it disappeared. Based on my experiences this summer, that usually meant that something had eaten the fish and taken the tag far away. But, in the days that followed I noticed tags go “missing” at a much faster pace than I ever saw over the summer. Looking to rule out possible downstream movements, I tracked Loyalsock one day. Sure enough, there they were. Now that we are nearly at the end, I can confidently say over 1/3 of fish tagged in September moved into the mainstem Loyalsock (and that proportion might be much higher once I determine how many tags were dropped in the stream. And, I’m sure more are on their way. There are a few fish that have been moving downstream in the past week and are probably on their way to Loyalsock now. Tributary to mainstem trout movements are not as uncommon as you might think. And, though only a handful of studies have documented this movement pattern, it makes a lot of ecological sense. Coming off of a stressful summer and increased activity with spawning, adult trout are literally starving. And, they know that they need to prepare for a long, cold winter ahead. In the winter fewer insects are emerging and the once bountiful streams lack significant sources of food for trout. But, mainstem rivers have many small fish that are not only plentiful, but have a higher caloric value than small insects. In fact, during sampling the last two days we found several trout with small trout tails hanging out of their mouths. Diets once made almost entirely of insects have quickly shifted to fish-dominated. 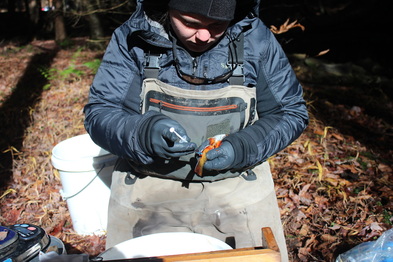 If I tell my advisor I am in torpor, do you think I can get out of winter field work? If I tell my advisor I am in torpor, do you think I can get out of winter field work? The mainstem also offers some thermal buffer relative to the smaller tributaries. As stream temperatures continue to drop, trout will enter into periods of dormancy known as torpor. Trout don’t actively choose to go into torpor; it’s a physiological response to cold water because, unlike humans and other endotherms, fish cannot maintain their body temperature. Their body temperature is the same as the water they are swimming in, and when they are cold their muscles don’t function as quickly as when they are warmer.
Torpor is likely, at least in part, an evolutionary response to a lack of food. While in torpor, fish metabolism is very low and they require very little energy to remain alive. However, while torpor may allow fish to survive cold winters, it also decreases their ability to continuing growing and reduces the amount of energy they can put towards producing offspring. But, by staying a little warmer during winter, fish occupying mainstem rivers will spend less time in torpor, more time feeding, and they can put more energy into growth and reproduction. So, in short, trout migrating to the mainstem have more food sources, grow larger, and maybe even produce more and healthier offspring. More interesting, though, is that only a subset of the population seems to engage in the behavior. Some seem hardwired to do these movements, and others content staying in the small streams. What causes this? Great question, but I have no idea. At least not yet. I still have over a year to figure it out. Graduate students do a lot of reading. And, sometimes, you stumble on a research article that is so obvious you wonder why you never thought about it before. For me, one such article was, “Landscapes to Riverscapes: Bridging the Gap between Research and Conservation of Stream Fishes” coauthored by Kurt Fausch and his colleagues in 2002. I first read this article as an undergraduate, and it’s probably been assigned reading in no fewer than five other classes along my academic journey. Every time I read it I think two things. First, “duh”. Second, “why are we (still) ignoring these concepts in our management of fisheries?” The take away message is that fish ecology is often not reflected in our design of research projects and management of fish populations. Seems like a major oversight, right? In everyone’s defense, it’s really difficult, perhaps impossible, to cover all aspects of a species’ ecology when designing a research project. For example, we’re lucky if we can scrape together enough funding to run a project for 2-5 years. But, many fish species live much longer than that and are affected by processes that occur much less frequently (e.g., disease, rare weather events) or over very long time scales (e.g., climate change, evolution). So, we end up with a series of studies with important results, but results that many not be entirely appropriate for the species of interest. For example, a short-term study on the effects of floods on fish populations might conclude that they are catastrophic. But, if you look 10-50 years later, you might find that they are beneficial. Likewise, scientific crews are often small, overworked, and under paid. We can only cover but so much area, and so we decide to sample a few hundred feet, maybe yards, of habitat. Or, we might use aerial maps to visualize entire watersheds. But, with these two approaches we’ve missed the spatial scale that is likely most important. Fish don’t stay put in one pool, or even a small stream segment. And, very often, they don’t move around the entire watershed. The scale that is probably most important, at least for trout, is measured in miles. But, sample crews can’t measure fish and habitat across miles of stream, and we certainly can’t use maps to document the fine-scale habitat features that are found in these stream segments. 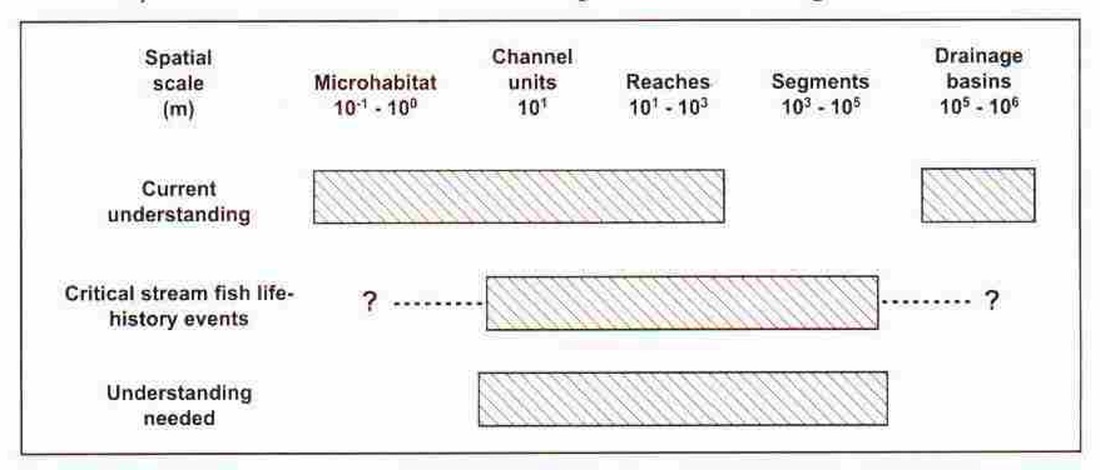 A figure from "Landscapes to Riverscapes" illustrating the scale gaps we have in understanding fisheries ecology. Many processes that influence fish life history happen at spatial and temporal scales that we aren't studying and aren't managing. 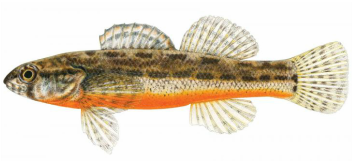 After years of study, a reasonable assumption would have been that the Arkansas darter stayed in isolated pools. But, that would have been incorrect, as it was found that the darters were able to make long-distance movements to new pools during rare storm events. After years of study, a reasonable assumption would have been that the Arkansas darter stayed in isolated pools. But, that would have been incorrect, as it was found that the darters were able to make long-distance movements to new pools during rare storm events. The scary thing is that our data often lie to us, and we don’t know that we’ve collected information at the wrong temporal or spatial scale needed to answer the research question of interest. We could study the same population of fish for decades and never see movement. But then, suddenly, a slight increase in temperature or a little bit more rain, and you may see long-distance dispersal (this happens in populations of Arkansas darters, which seem to make long-distance movements, but only every 5-10 years after heavy rains). Or, we might study a species only during summer (which is common) and miss seasonal behaviors or changes in habitat use that correspond to different stages in the individual’s life cycle. And, if we do that, we may (and often do) falsely conclude that fish don’t move or make some other inaccurate statement about a species’ ecology. Even more scary, these rare events and small-scale habitat features that we very often miss in our studies are some of the most important for fish populations. It’s the rare, long-distant movements that recolonize streams and connect populations. And, it’s the seasonal use of tiny areas of ground water upwelling or short-term occupancy of unique habitat features that fish use to spawn or survive thermal stress. 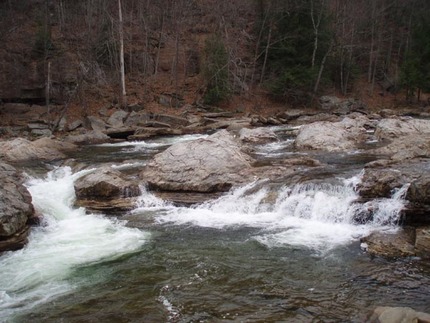 Upper sections of Loyalsock Creek are a fisheries biologist's sampling nightmare. Wading through it is like trying to walk on greased bowling balls, and parts of scuba destination. Who knows what's actually in there. Upper sections of Loyalsock Creek are a fisheries biologist's sampling nightmare. Wading through it is like trying to walk on greased bowling balls, and parts of scuba destination. Who knows what's actually in there. Though scientists are starting to realize the inadequacies of our studies (not to say we are fixing them, our hands are often tied), management hasn’t always kept up. For starters, managers’ hands are also tied. They can only work with the information they have and, as I’ve said, the information is often inaccurate or missing. But, sometimes, the protocols in place for protecting fish species need updating to better reflect improved information on species ecology- information that highlights the importance of considering different temporal and spatial scales in management plans.
Take for example Pennsylvania. In Pennsylvania waterways are given a designated use classification based on the aquatic species present. The streams I’m currently researching have different designated uses depending on the exact location, but include “Exceptional Value,” “High Quality Cold Water Fishes,” and “Migratory Fishes,” largely due to the presence of healthy trout populations. But, Loyalsock Creek itself has a designated use for ‘Cold Water Fishes’ indicating the river is used to propagate or maintain cold water species, including trout. What’s the problem? This designation system emphasizes population size, which is a very reasonable approach when considering the data in hand and average conditions. Shanerburg Run is a high quality system because there are far more trout there than in Loyalsock Creek and, unlike Loyalsock Creek where summer temperatures far exceed trout thermal tolerance, Shanerburg Run can support trout all year. Further, evidence of wild trout in Loyalsock Creek has been limited because most sampling occurs in summer (when Loyalsock is too hot) and the system, which is a combination of deep pools, shallow riffles, and large boulders, is test for all fisheries sampling gear. However, as we are learning from our telemetry study (and perhaps the anglers of Loyalsock already knew), Loyalsock Creek may be critical over-wintering habitat for a sub-set of brook trout. They don’t stay there all year, and it’s certainly only a small proportion of fish, but these nomadic individuals may be critical for sustaining brook trout population connectivity. As I talked about in my post last week, connectivity greatly improves population health by increasing genetic diversity and lowering the probability of population extirpation. So, protecting these fish may be disproportionately more important when considering conservation strategies. Given this, are main stem rivers getting enough protection in brook trout watersheds? It’s hard to say. This is one case on one small scale with results that are still unfolding. But, it does highlight the need to think beyond “average” and consider how fish habitat use may change depending on the time and space scale you are considering. 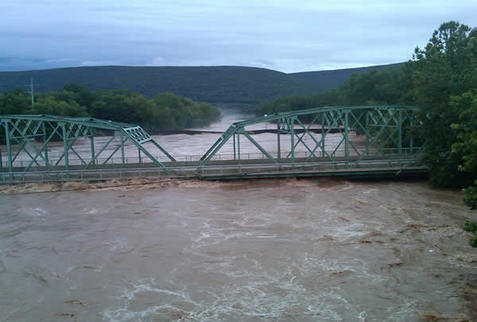 Large floods, like the historic 500-year event that hit Loyalsock Creek in 2011, are surprisingly necessary for long-term trout survival. Photo courtesy of PA State Police. Large floods, like the historic 500-year event that hit Loyalsock Creek in 2011, are surprisingly necessary for long-term trout survival. Photo courtesy of PA State Police. There’s been a reoccurring theme in my posts- stream flow is really important. When streams rise too far, trout can wash downstream and die. When there isn’t enough flow, stream temperatures rise, oxygen availability declines, fish become trapped in isolated pools, and, you guessed it, they can die. But, trout aren’t the Goldilocks I may have led you to believe. Headwater streams are some of the harshest environments an animal can live in. They are a complex mosaic of habitats- riffles, runs, pools, glides- all connected by the unpredictable flow of water. Flood stages and drought conditions can be separated by only a few hours. Stream temperature changes quickly with rain and air temperature. Aquatic macroinvertebrates, a trout’s major food source, follow their own schedule, and fish have to sit and wait for a causality to float downstream (and in doing so expose themselves to predators). The only thing predictable about headwater streams is that they are unpredictable. Rivers and large streams are less erratic than headwater creeks, but these larger systems are often too warm for trout and don’t have the right food sources (though, some trout can use these habitats…a story for later). So, for most of the year, trout are basically stuck in these unpredictable headwaters. To survive, trout need to be tough. But, it also takes a team effort. In this case, the “team” I’m talking about is the ecosystem. And on this team, unpredictability isn’t just something that organisms have evolved to survive, but is a necessary player. And, one element of unpredictability needed for survival are what we humans have decided to call “natural disasters.” Take floods, for example. Loyalsock Creek has had its fair share of flooding the last five years. In 2011 there was a 500-year flood (meaning stream flows are predicted to get that high only once every 500 years). And, just last week, parts of Loyalsock were hit hard with floods that washed away bridges and homes. These events are devastating for humans because we’ve decided to build structures alongside streams. But, trout depend on floods for long-term health for several reason: Floods clean streams: Trout hate sediment. It scratches their gills, suffocates their eggs, and decreases overall water quality. It can also be a source for diseases and parasites. Even the healthiest streams receive sediment from erosion of riparian land, and the only way to clear it from the stream is with high-velocity stream flows. In a forested watershed, the average rain event will cause little change in stream flows. Streams flows may increase more in an unforested watershed (because there are fewer trees and plants to absorb rain water), but total stream sediment increases because of more riparian erosion. Really high flows and floods are needed to completely clean the system. These high flows cause fine sediment and small gravel to become suspended in the water column and wash downstream. As sediment is passing by, it scrubs algae off rocks and boulders and uncovers a fresh stream bed. What’s left is cleaner trout habitat with less fine particles. Floods create habitat. If you fish, you know some of the best trout habitat includes submerged logs and large boulders. These features create deep pools and are good hiding spots for trout trying to avoid predators. But, they are extremely heavy. Luckily, water is very powerful. Heavy rains erode banks and cause riparian trees to fall into the stream. But, really heavy floods mobilize trees and boulders from much further away. A large pulse of water can cause a downed tree from the hillslope to enter the stream and become trout habitat. In fact, the lack of fallen trees in watersheds that have been historically logged is a common source of habitat loss in trout populations. Forests less than a century old may appear healthy, but most trees are likely to still be standing and so less wood is available to enter streams during floods. 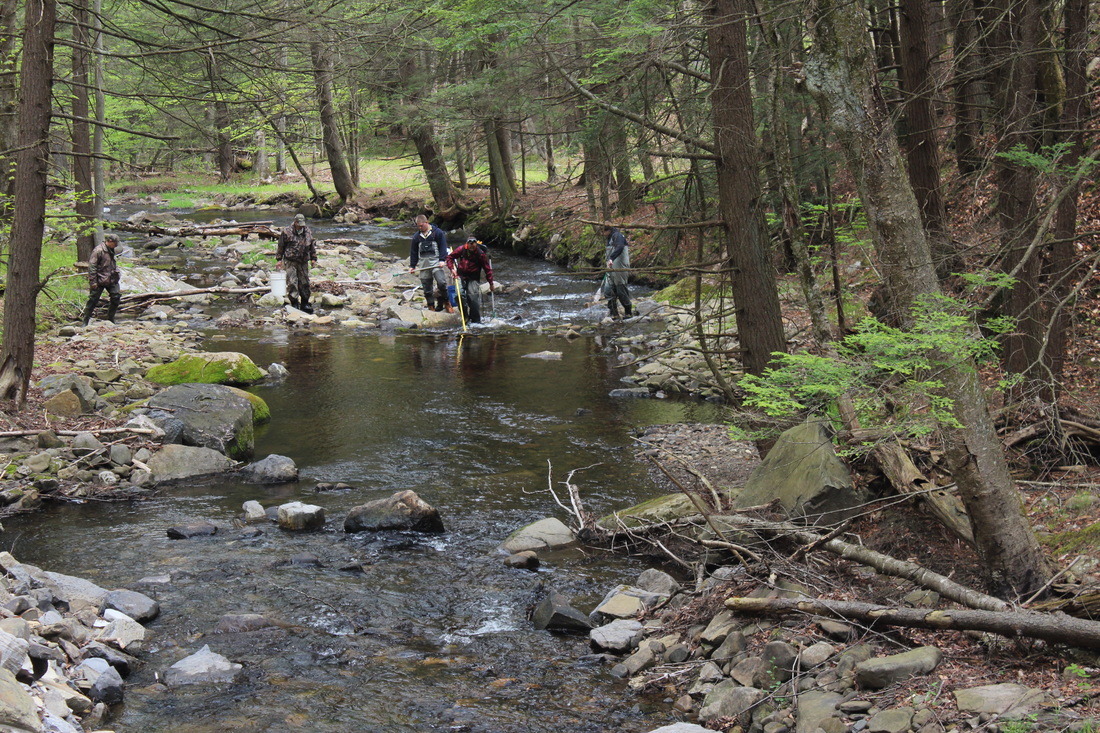 To the naked eye, Shanerburg Run looks like a healthy trout stream. But, the lack of submerged logs is a sign of a watershed still recovering from historic logging. Floods reconnect populations. On average, trout are good at hunkering down and staying put during high flow events. But, in flood conditions, many fish do get washed downstream. Some likely perish, but survivors find new habitats. This can cause new streams to become colonized or temporarily connect otherwise isolated populations. This is extremely important because connectivity is key to long-term population survival. Populations that are connected have higher genetic diversity, meaning there are more forms of a gene present in the population. This is critical, particularly in highly variable environments like streams, because different genes are better at surviving different forms of stress. Let’s think about a fake example that will bring this point closer to home. A population with low genetic diversity in humans may have, for example, a high proportion of people with blue eyes. If there is a lethal disease that effects only people with blue eyes, then that population would quickly die. However, a population with high genetic diversity may have an equal number of people with blue, green, and brown eyes. Now, if the blue-eyed killer hits, the population declines, but the damage is limited to a small subset of individuals and the population survives. Though this is a fictitious example, similar scenarios do happen in natural populations frequently.  A population with high genetic diversity (represented here as dot colors) is more capable of surviving a catastrophe or disturbance. Here, only the red and blue genes were capable of surviving, but the population did not die. Had the population had less diversity, perhaps only green and orange dots, the population would have died following the catastrophe. So, in short, trout thrive on human catastrophes. At this point in my research, I would expect nothing less of my study organism.
In the week ahead- it’s (maybe) our last full week of tracking! Hard to believe after six months I can see the finish line. And, I think we are finally documenting the movement patterns we were hoping to see when we started this study. Vague? Yes, but I don’t want to get too excited just yet. |
AuthorShannon White Archives
October 2018
Categories
All
|
The Troutlook
A brook trout Blog
 RSS Feed
Proudly powered by Weebly