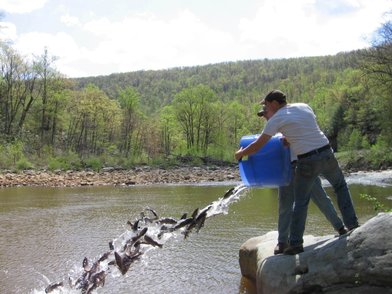
 Buckets, tubs nets, and flumes...there's a lot of effort involved in stocking millions of fish. Photo courtesy of maryland.gov. Buckets, tubs nets, and flumes...there's a lot of effort involved in stocking millions of fish. Photo courtesy of maryland.gov. In the next few weeks, millions of trout (nearly 4.6 million in Pennsylvania, alone) will be stocked nationwide to improve and encourage angling opportunities. We all have opinions on fish stocking. And, if you’re like me, those opinions may not be so cut and dry. Native vs. nonnative. Stream location. Source population. Angling pressure. It all weighs into what you believe is the “right” choice for a particular stream. But, if you’re also like me, your opinions about stocking probably focus mostly on the fish. Will the stocked fish compete with the native fish? What happens if the stocked fish start reproducing in areas they are released? Sometimes we might extend our thinking to other organism, such as how adding more fish to a stream could impact the abundance of macroinvertebrates (i.e., food), which could ultimately decrease fish growth. It’s not too often we think about how fish stocking could affect an entire ecosystem. And, when we do, it usually still revolves around organism-level effects (such as declines in bats, birds, and spiders with nonnative fish stocking…a story for another day). But, what about the effects of stocking on, say, nutrients? Thinking about nutrients can be a little difficult because you can’t usually see them, or their effects, directly. But, flowing through the water are microscopic minerals and particles that are the building blocks for life. You’re probably more familiar with this concept than you realize- when you fertilize your garden you are adding, among other things, the nutrients phosphate and nitrogen to speed up growth. In streams, these nutrients are floating in the water, and organisms, particularly algae and other plants, absorb them to grow. The amount of nutrients available can limit the number of plants, insects, fish, even terrestrial animals that an ecosystem can support. Natural ecosystem have evolved a tight network that maximizes nutrient use to support the most number of critters possible. And, generally speaking, we don’t notice nutrient problems until something gets out of balance. For example, algal blooms are the result of excess nutrients entering streams, often from runoff from urbanized areas. Too many nutrients leads to too much plant growth, which ultimately can lead to loss of oxygen in the water and death of aquatic life. 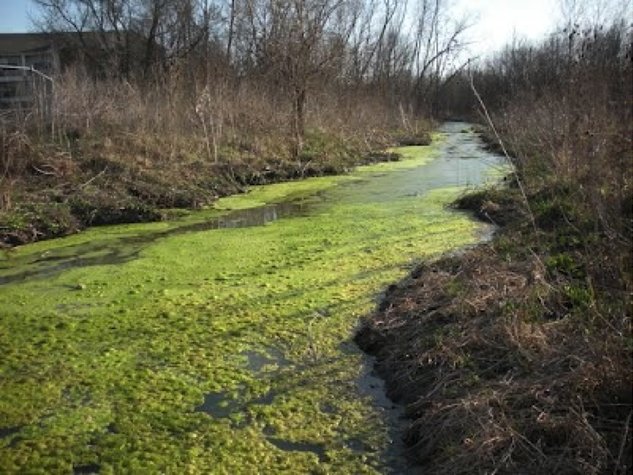 Algal blooms are one of the first warning signs of a stream that has too many nutrients. Photo from kansasriver.org.  Look at all those nutrients! Look at all those nutrients! Now, let’s turn our attention back to the fish. You can think of fish (and any living organism, for that matter), as a super concentrated packet of nutrients. Body tissues are loaded with nutrients, and at any given moment fish are eating, absorbing, digesting, and secreting even more nutrients. So, if fish are concentrated packets of nutrients, what effect does stocking have on the balanced ecosystem? This question was addressed by a group of researchers from Cornell University who evaluated the effects of stocked, nonnative brown trout on stream nutrient levels. They specifically focused on forms of nitrogen and phosphorous- two of the most prevalent nutrients that can quickly become too abundant and decrease overall water quality. For starters, fish stocking results in immediate increases to ecosystem nutrients. If you add thousands of new fish bodies to an ecosystem, then you are also increasing the amount of nutrients, often by orders of magnitude. This is a pretty obvious conclusion, yet I had never thought about stocking in that way before. 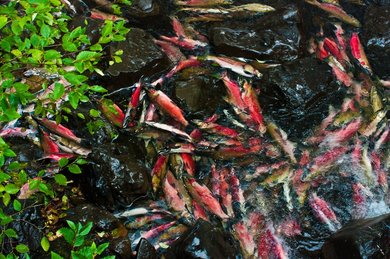 Sudden death of trout with increased stream temperatures would result in a rapid increase to stream nutrients. This process already happens out west, when anadromous salmon return to streams to spawn and shortly thereafter die, leaving millions of carcasses sprawled along the streambanks. Photo from critfc.org. Sudden death of trout with increased stream temperatures would result in a rapid increase to stream nutrients. This process already happens out west, when anadromous salmon return to streams to spawn and shortly thereafter die, leaving millions of carcasses sprawled along the streambanks. Photo from critfc.org. Once fish are in the streams, they start excreting waste, and waste is full of nitrogen. Stocked fish excreted up to 85% of the total ecosystem nitrogen demand when, in comparison, native fish only excrete 0.5% of ecosystem demand. That difference is huge! And, with more nitrogen floating around streams, there is greater potential for nutrient imbalances that can harm fish. Interestingly, stocked fish didn’t excrete much phosphorous, and so there was no effect on that nutrient.
From there, things get interesting. In this study, angler harvest, predation, and natural mortality resulted in quick removal of most stocked fish from the systems. So, the effects of stocking to nutrient loads were not long-lasting. However, what if those fish had survived? What if fish were stocked in a catch-and-release system? In this case, stocked fish have the potential to not only have long-term impacts to nitrogen, but also increase other nutrients through reproduction (fish eggs are very high in nutrients) and in death (fish carcasses are even higher in nutrients). Mortality is particularly important when considering that many trout are stocked in streams that get too warm in late spring and summer, meaning that stocked fish are predicted to all die around the same time of year. If those carcasses are all decomposing in spring, at roughly the same time as many plants are starting to come out of dormancy, then excess nutrients could increase growth of aquatic plants and cause declines in overall ecosystem health. The effects of stocking are somewhat limited in small streams where nutrient levels are already high, and so ecosystem processes are unaffected by the addition of even more nutrients. However, mid-reach rivers and lakes are often nutrient poor. Initially it might seem like stocking in nutrient poor areas is a great thing. But, remember, ecosystems have evolved to operate under their own natural nutrient levels, even when they are low. So, adding nutrients will open the door for growth of plankton and algae and, ultimately, loss of water quality (you may be sensing a theme, here). It may sound like I’m trying to convince you that fish stocking is bad. It’s not. At least not always. It’s just a very complex issue, and the complexities are a lot deeper than many, including myself, sometimes realize. So, hopefully this post just makes you think a little harder next time you see the trout stocking schedule for your favorite steam.
0 Comments
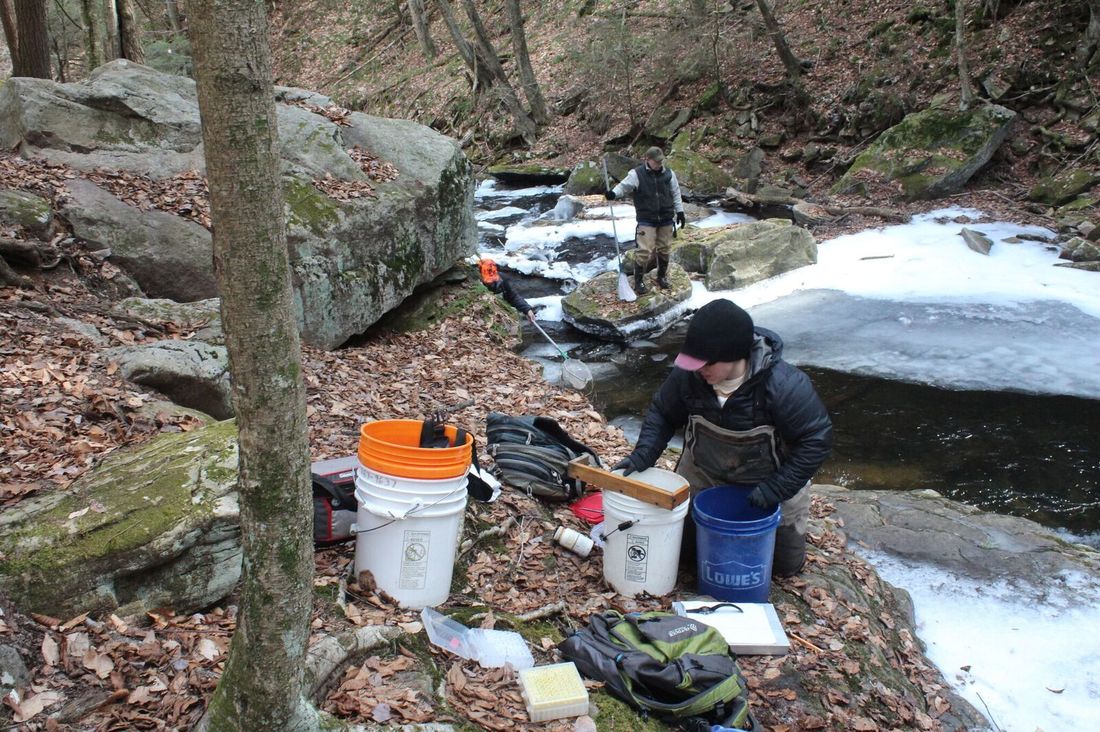
We tried, but Mother Nature just wasn’t having it this week. Ice-capped streams and high flows followed by heavy rains and 50 mph wind gusts made the decision to delay sampling easy. Unfortunately, the next ice age is about to descend on Pennsylvania, so shop is closed for the foreseeable future. But, we did manage to add 43 fish to the collection on Monday. And, with water temperatures peaking around 33°F, I think I also managed to lose some nerve endings in my hands. 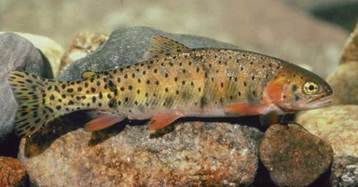 The Colorado River Cutthroat Trout is a relative of rainbow trout (both in the genus Oncorhynchus). Image courtesy of Wikipedia. The Colorado River Cutthroat Trout is a relative of rainbow trout (both in the genus Oncorhynchus). Image courtesy of Wikipedia. Thawing back in the office, I’ve been thinking through the genetics dataset a little more. With the preliminary analyses done, we’re starting to think about other, less common, analyses that may give interesting results. Sure, the descriptive statistics are great, but we have a suspicion there’s more interesting conclusions yet to be uncovered. Scientific detective work isn’t that glamourous- it’s mostly trying different search terms in Google and reading literature. And, let me tell you, those genetics papers are not exactly page turners. After amassing a large collection of manuscripts that seemed relevant (thank goodness for electronic copies) and running out of excuses as to why I hadn’t started reading, I poured myself a big cup of coffee and…..couldn’t click on a title. I guess I’ve gotten a little burnt out on the topic. But, in the long list of genetics papers there was one title that stuck out like a sore thumb. It had nothing to do with genetics, which of course made it an obvious choice to read first. The paper was titled “Nonnative trout invasions combined with climate change threaten persistence of isolated cutthroat trout populations in the southern Rocky Mountains.” That’s right, the manuscript (which can be found by click on the hyperlink in the previous sentence) isn’t about east coast streams, and the title doesn’t even directly mention my precious brook trout (but, knowing the system, I knew the “nonnative” trout they were referencing was brook trout). But, this paper intrigued me for a few reasons. For starters, the second author, Kurt Fausch, had sent it to me a few weeks ago. I’ve academically ‘grown up’ reading Kurt’s work, and his studies have always inspired me to be a better fisheries ecologist. When you’re deep in the weeds of your project, a little inspiration never hurts. 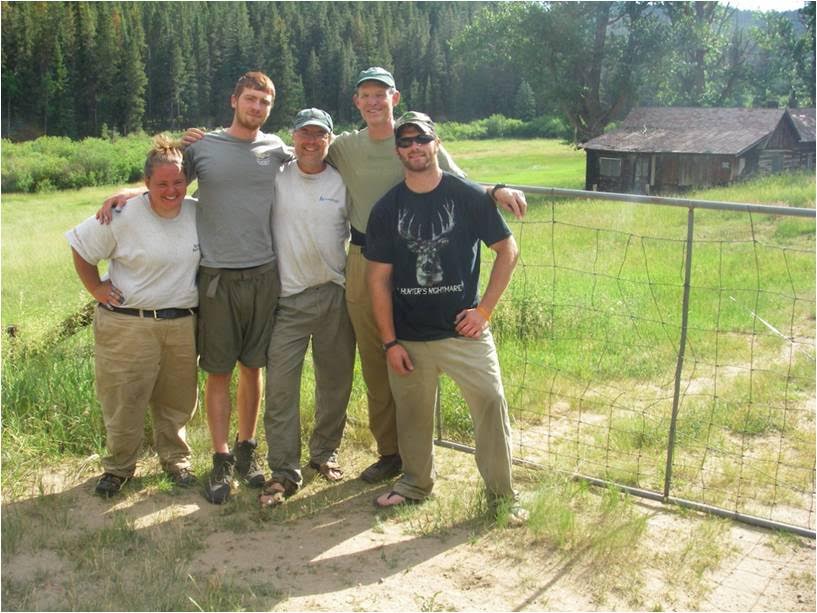 What I wouldn't give to go back to my undergrad research in Colorado, 2009. Picture right to left, Josh (still one of my best friends), Kurt, Chas. (my undergrad advisor), and his son Charles. And, yes, I'm short...but Charles and Kurt are also tall. Second, though the main actors are different, the story line could have easily been written for east coast trout populations. The manuscript models the effect of climate change and nonnative fish invasion on the persistence of 309 native trout populations. In this case, the native trout were cutthroat trout, and the nonnative are brook trout (recall: brook trout are only native on the east coast, and are an invasive nuisance out west). You may be able to guess the main result- climate change and nonnative species cause a decline in cutthroat trout populations. But, which factor has the strongest effect? And, how fast do we expect cutthroat populations to decline once invaded? This is where I found the results to be a bit surprising. In the absence of nonnative species, the effects of climate change on cutthroat trout populations are almost negligible- the authors only predicted one of the 309 populations would go extirpated by 2080. But, add in brook trout invasion, and that number goes to 122 extirpated cutthroat populations with another 113 at risk of extirpation. Shocking still, extirpation happens really fast. On average, the authors estimated that brook trout move upstream about 50 feet a day (mostly during summer), which results in about 10 miles of invasion per decade. Looking at historic trends and doing a little more math, they estimated that it takes as little as 7 years for cutthroat trout populations to become extirpated once brook trout move in. To summarize another way, for the cutthroat trout populations studied, invasive species matter a whole lot more than climate change. And, the timeline from invasion to extirpation is fast, giving managers very little time to implement management decisions to prevent extirpation. Bringing things back to the east coast, many of you may be thinking I’m getting ready to climb atop my soapbox and talk about the destruction of native brook trout populations by nonnative brown and rainbow trout. But, I’m not. At least not entirely. Cutthroat trout populations are more sensitive to invasion than most brook trout populations. So, I do not want to imply that the results of this manuscript are directly transferable to native brook trout streams. As many of you know, brook trout and brown trout can persist together far longer than 7 years. However, nonnative trout do threaten brook trout, and this paper does a great job of summarizing the mechanisms behind those invasions and species turnovers (there’s the soapbox). 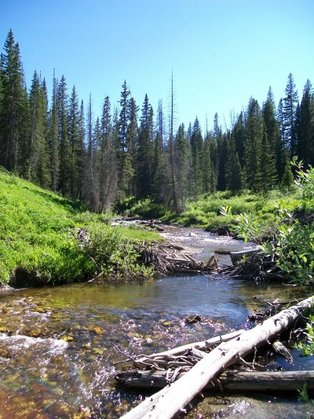 Still dominated by snowmelt in July, Colorado streams aren't entirely comparable to those on the east cost ecologically, but they are just as pretty. Photo courtesy of Josh Harris. Still dominated by snowmelt in July, Colorado streams aren't entirely comparable to those on the east cost ecologically, but they are just as pretty. Photo courtesy of Josh Harris. What I do want to call attention to is that the authors found that climate change alone had very little impact of cutthroat trout populations. This is important. Climate change is definitely a major threat to trout populations, and certainly more of a threat on the east coast than the Rockies. But, we have become so fixated on climate change as THE threat that we may have lost focus on other, potentially remediable, threats to brook trout populations. Yes, stream temperature rise is going to extirpate brook trout, likely having more severe threats than climate change on cutthroat trout. But, studies have shown that many mountain headwater streams are buffered from the effects of climate change and may not see the big increases in temperature that we project for larger waterways. For these systems, nonnative fish invasion may matter a lot more for brook trout persistence than climate.
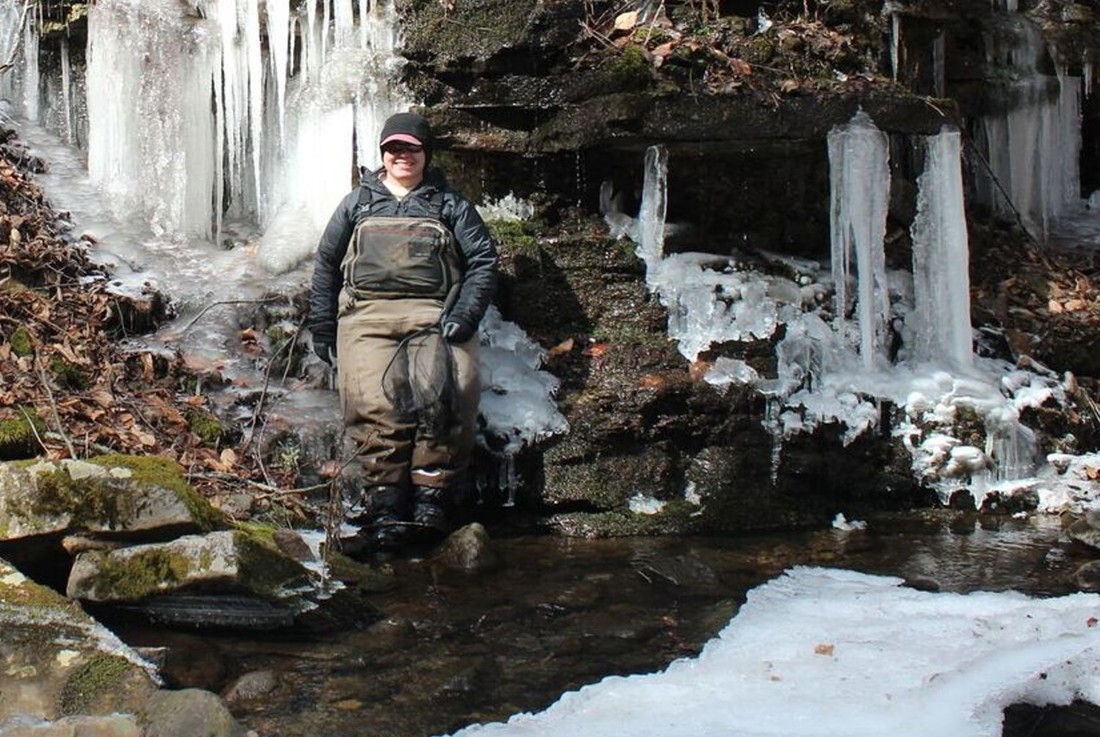
And, at some level, we can fix nonnative fish invasions. At the conclusion of the article, the authors discuss how their findings can be used in cutthroat trout management. In particular, they suggest refocusing management efforts away from “lost cause” populations (my words, not theirs) that are already heavily invaded and towards cutthroat trout populations that are still uninvaded by brook trout. They even go so far to suggest building barriers to prevent upstream migration of nonnative trout. Of course, movement barriers will also isolate populations causing potential negative consequences to genetic diversity. And now I’ve circled back around to genetics. I just can’t escape. *Note: Content in this post is my own and may not reflect the opinion of the manuscripts' authors or the agencies they represent. I encourage you to read the manuscript so you can contribute to the discussion. 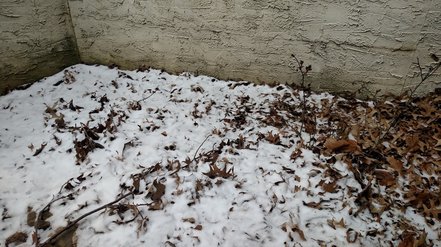 There's a peony and rose bush in this photo. Seriously. They are dead. And this is not the signs of spring. There's a peony and rose bush in this photo. Seriously. They are dead. And this is not the signs of spring. After a short three-month hiatus, the Loyalsock trout crew is loading the trucks and preparing to hit the streams for “spring” sampling. The term spring is really being thrown around loosely here…there is snow on the ground, it was 13°F this morning, and trees and flowers still appear dead (some may call this death-stage dormancy, and while science would call them right, I say you can’t trust a plant until it comes back green). The goal of this sampling is easy- go out, find fish, collect gill samples, and ship gills to West Virginia so they can analyze for gene expression. If all goes as planned, at the end of next week we will have collected gill samples every 1-3 months for a full year. It will also up our total sample size to near 600. That’s a lot of vials of fish gills. More vials of fish gills than most other studies. And, our gills are collected on wild trout in natural systems. My background on gene expression studies is severely lacking, but I’ve learned that we are sailing in largely uncharted waters with this study. Specifically, our sample sizes are large, we are not working in a controlled laboratory environment, and we have multiple samples on the same individual fish over time. 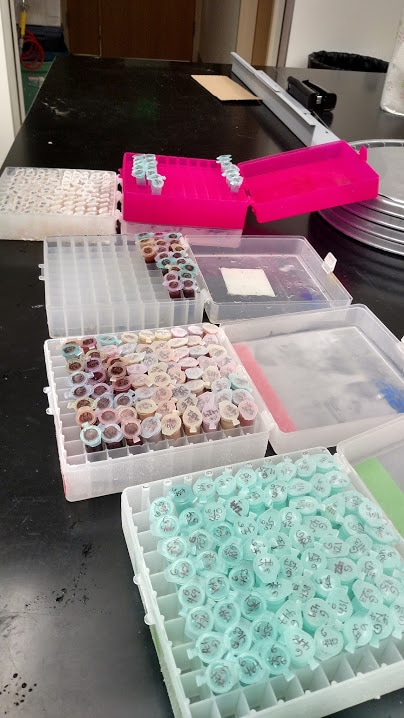 Vials on vials on vials. The best part of this sampling is that those tissues need to go to -80 degrees every night. So, the Penn State folks get to add four hours of quality drive time to each of our sample days. That’s not to discount the significance of any other study- all of this stuff is pretty cutting edge, and valuable data is being gathered from everyone working in this field. In fact, lab studies have a lot of advantages that wild streams don’t. I have to wait for stream temperature to rise and, because Loyalsock is two hours away, hope I pick a critical time for collecting tissue samples. But, with the flip of a switch, we can change temperature in artificial stream labs and immediately expose fish to temperatures that we are interested in measuring heat shock expression in (recall: heat shock proteins are produced in response to heat stress to prevent cell death). But, streams don’t really work like labs. Stream temperatures rise and fall much faster than we can readily mimic in a laboratory environment. And, gene expression is highly sensitive to this variation. This leaves us at a bit of a catch-22. We can control temperature in labs but, because tight control leaves little variation, the data may not reflect patterns of gene expression in wild trout populations. Streams, on the other hand, have all the variability we need, but we don’t know what aspect of the variation actually matters to trout. Simply put, we don’t actually know what triggers heat shock protein expression. Yes, it’s heat. But is it average stream temperature over the last three days? Week? Month? Or is it difference in maximum and minimum stream temperature? Or, time at a certain temperature? Even if we did know what aspect of variation triggered protein expression, it would be really hard to find the sampling window of most interest without camping streamside and recording temperature every 30 minutes. 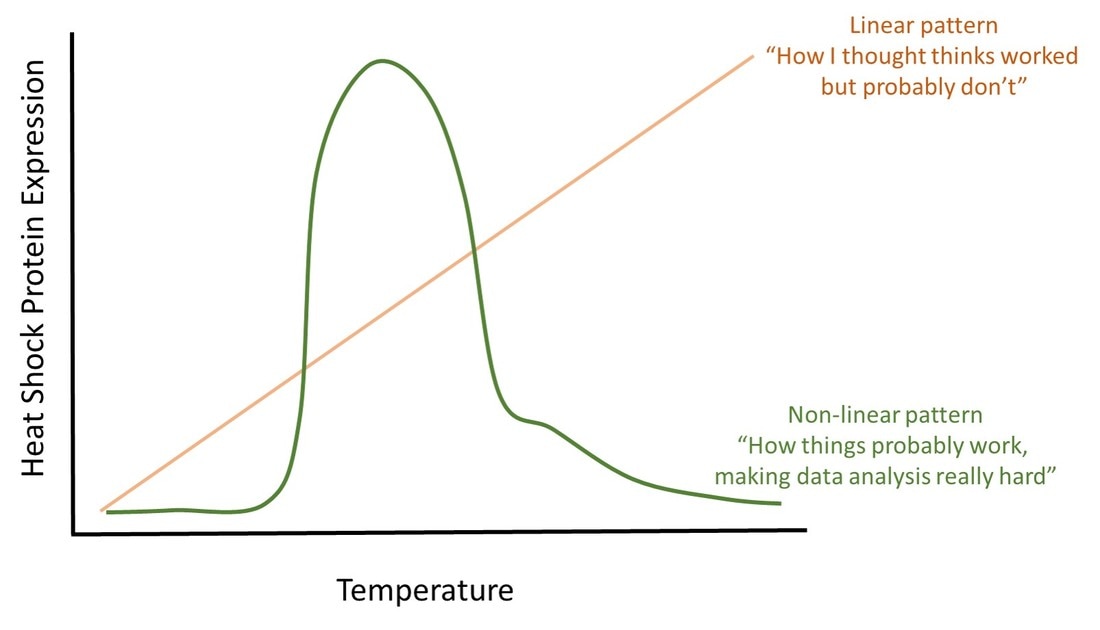 Putting words to picture: Heat shock protein expression probably isn't a linear pattern like the orange line above. Therefore, we don't see highest expression at high temperatures. Heat shock protein probably peaks at moderate temperatures, and finding those temperatures is much harder. We’ve hit this wall with our data so far. Some of our lowest heat shock protein expression is from July, when water temperature were near their highest. No, this doesn’t mean our data are wrong. It likely means that conditions between May-July triggered heat shock protein expression, and once the proteins were floating around in the fish’s’ system, they stopped expressing the gene. So, we missed the critical window.
And, that’s okay. It’s still providing us great information into how trout are responding, molecularly, to stream temperatures. It also gives us a better idea of when we should sample if we want to catch peak gene expression. Like, maybe March. No, stream temperature are not high in March, but they will be starting to rise from winter lows. And, we know expression in May is not high. So, could it be this increase in temperature in March that triggers expression? Maybe. And we’ll soon know 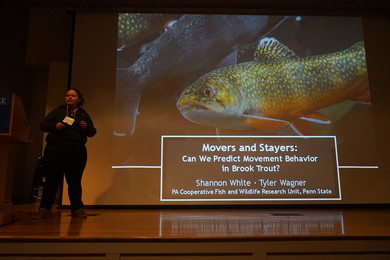 The start of what would be the winning Best Paper Award. Thanks to Don Orth (my former Master's advisor) for capturing the photo from the audience. The start of what would be the winning Best Paper Award. Thanks to Don Orth (my former Master's advisor) for capturing the photo from the audience.
This past week I traveled to Lexington, Virginia to attend the annual meeting of the Virginia Chapter of the American Fisheries Society. Why would I go to a Virginia conference? Mostly because I wanted to. From my first conference in 2008, mentor lunches that helped guide my way, meeting my would-be Master’s advisor, and several leadership positions that led to awards and fellowships, I owe lot of my interest and success in fisheries to members of VCAFS. It had been a couple years since I was able to get back to a VCAFS meeting, but now with some data to present and a little break in field work, it was a great opportunity to return home. I received a great homecoming from many of my former professors and state biologists, and I even managed to win Best Paper for my talk on trout movement in Loyalsock Creek.
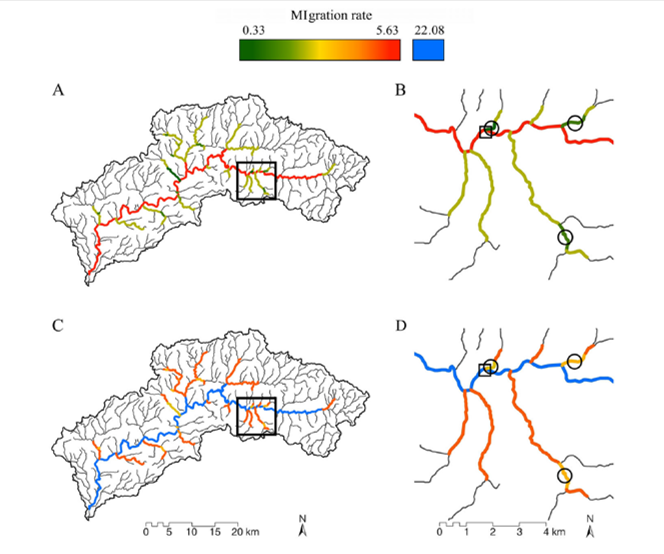
But, now, winter conference season is officially over. Ahhhhh… Conferences are great. Lots of reunions with old friends and colleagues, handshakes with people you’ve only “met” through email and literature, and it’s also the start of many future collaborations. But, it’s also a lot of poor eating, lots of science that melts your brain, and really long nights. It’s an exhausting type of fun, and for now I’m glad to be unpacking the suitcase for a little bit. Because I’m mostly melting into the couch today, I’m taking an opportunity to share with you a video Danielle Massie made from some photos we’ve amassed during the field season last year. It’s a great tool for describing why I’m doing the research I do, and I’ll be posting it throughout the website so that visitors can quickly learn more about the work the Penn State trout team is doing (it the link below doesn't work, it can be found by clicking here) Next week, it’s back to field preparations. Can’t believe the winter has already flown by. Happy watching! 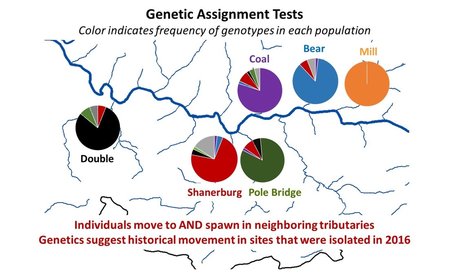 Results of genetics assignment tests for six streams near the telemetry study area. Each pie chart represents the proportion of fish in a population that that were born in that stream. For example, Double Run shows a mixture of fish from Double (black), Shanerburg (red), Pole Bridge (green) and locations outside of the study (grey). Results of genetics assignment tests for six streams near the telemetry study area. Each pie chart represents the proportion of fish in a population that that were born in that stream. For example, Double Run shows a mixture of fish from Double (black), Shanerburg (red), Pole Bridge (green) and locations outside of the study (grey). Last week I presented some preliminary genetics results using the image to the right, and used it as evidence that brook trout moving into Loyalsock Creek likely spawn outside of their home stream in later years. To put it another way, the fact that we see a mixing of genes at most locations (except for Mill Run), means that these populations were at least historically connected (and the telemetry data suggest at least some of them probably still are now). Genetics data are such terrible guests for a blog. They come in unannounced, make a mess of the place, and don’t know when to leave. In this case, the mess they created was a lot of questions about what we expected this data to look like. While I’m excited that people want to know more, the answer just isn’t that easy. For starters, my expectations of this dataset were zero. As you may recall, I hate genetics. My feelings towards the field are starting to evolve into a past-tense form of repulsion, but every day remains a struggle. Those with a basic understanding of population genetics may have looked at that figure with doom and gloom and wondered why in the world those populations are so isolated. Separated by only a stone’s throw, we would expect all of those populations to be genetically very similar. This is particularly true when we think of land dwellers, which are generally more mobile than aquatic species. In fact, for many terrestrial species and larger-bodied fishes, we’d probably have to separate populations by many miles before we start seeing genetic isolation similar to the above diagram. But, those that study headwater fishes may have found the results to be of no surprise. Most headwater fishes have very limited dispersal, owning to the fact that downstream habitats become increasingly wider and hotter with faster flows, making them less suitable environments for species that have evolved to live in tiny streams. There are also more predators downstream, so small bodies that are perfect for small streams quickly get eaten by larger fish like bass, pike, etc. All this to say, interpreting genetics data is a not entirely straight forward. We can get numbers that tell us things about genetic diversity, population isolation, and anything else you might be interested in knowing. But, that’s not the full story, and those numbers are actually meaningless, and potentially dangerous, if used out of context. Our expectations for what the results should be really depend on the species, study location, historic stream use, stocking, etc., etc. It’s a bit of a detective game. So, for those interested in specific numbers describing diversity, FST, AR, NE, rxy, you’re out of luck. They’ll appear in a publication eventually, but only sparingly in this blog. What I will do is compare, in broad terms, how our data stack up against other studies of brook trout. For starters, our genetics data cover far more than just the sites in that figure. We sampled 28 streams across the Loyalsock Creek watershed, making our study one of the largest scale studies of brook trout population genetics. 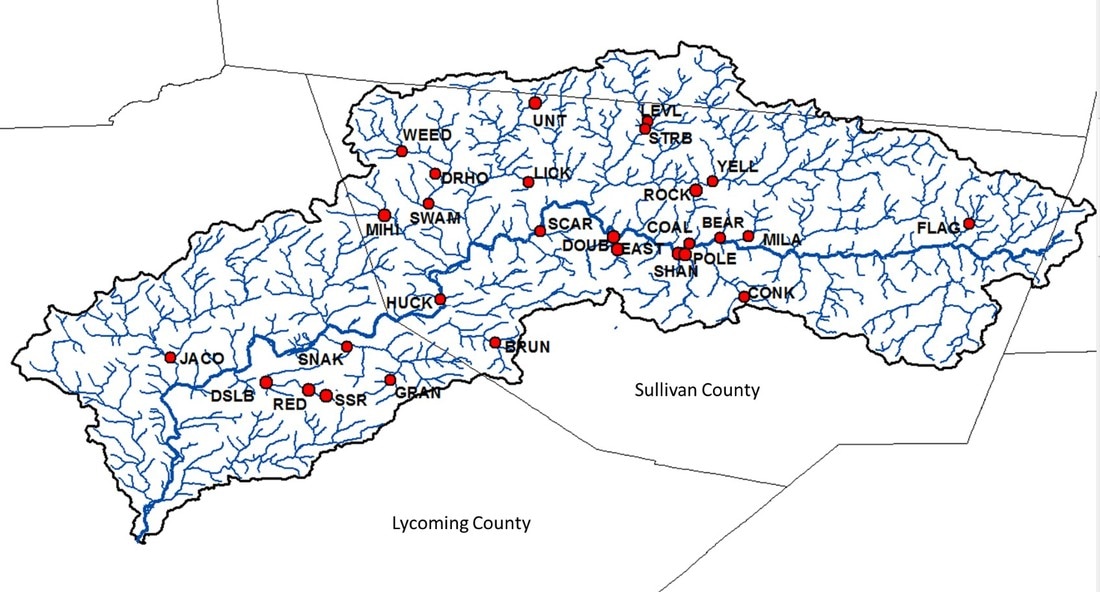 We covered some ground in 2015 when we did our genetics study. Our 28 sites have a good mix of locations nearby and sites really far away allowing for some interesting comparisons. Usually changing the scale of a dataset means that you can use your results to answer new questions, questions that may be more appropriate for how we manage species. For example, genetics data are usually collected at the scale of a single stream or maybe a few streams in a small area. However, we don’t generally manage fish at this small of a scale. We generally make management decisions for entire watersheds. So, given that we now have genetics data for an entire watershed, it makes sense that we can now shed new light into the population genetics and management of brook trout at a watershed-level. Wrong. But, don’t feel bad. I led you on. The reason our dataset isn’t all that revolutionary, at least at the surface, is because brook trout populations are known to quickly isolate, even at fairly small spatial scales. Even side-by-side tributaries can be isolated from one another. So, if we see isolation at small scales, it’s not that surprising to see isolation at large scales. And, it’s no secret that that is what we’ve found in much of our dataset. Sites that are separated by 3+ miles are isolated from one another, and that’s pretty typical for brook trout. That said, brook trout genetics are very diverse, particularly at sites separated by less than a mile. Sometimes they are genetically different, and other times they aren’t. To me, this is where things get interesting. If two sites are separated by the same distance and similar habitat, why do we sometimes see isolation and other times connectivity? I don’t have an answer, but we’re hoping to explore this question with our dataset. And, we have some preliminary ideas. For example, we see that sites near a mainstem river system seem to have more connectivity than sites that are connected by a mid-reach run. What is it about mainstem rivers that makes them better for connecting fish populations? Or, to really wig your brain, what is it about fish living near a mainstem that makes them different (i.e., more mobile) than fish living higher in the headwaters?  Salters and coasters are known for getting large and, as you can see in this salter, losing coloration during migration. Salters and coasters are known for getting large and, as you can see in this salter, losing coloration during migration. That last question may seem a bit far-fetched, but brook trout are known for having a diverse range of life histories. Many of you may be familiar with “coasters,” brook trout living in Lake Superior that make long-distance migrations into the lake’s tributaries to spawn. There are also “salters” which spend a significant portion of their life in saltwater before returning to smaller freshwater tributaries to spawn.
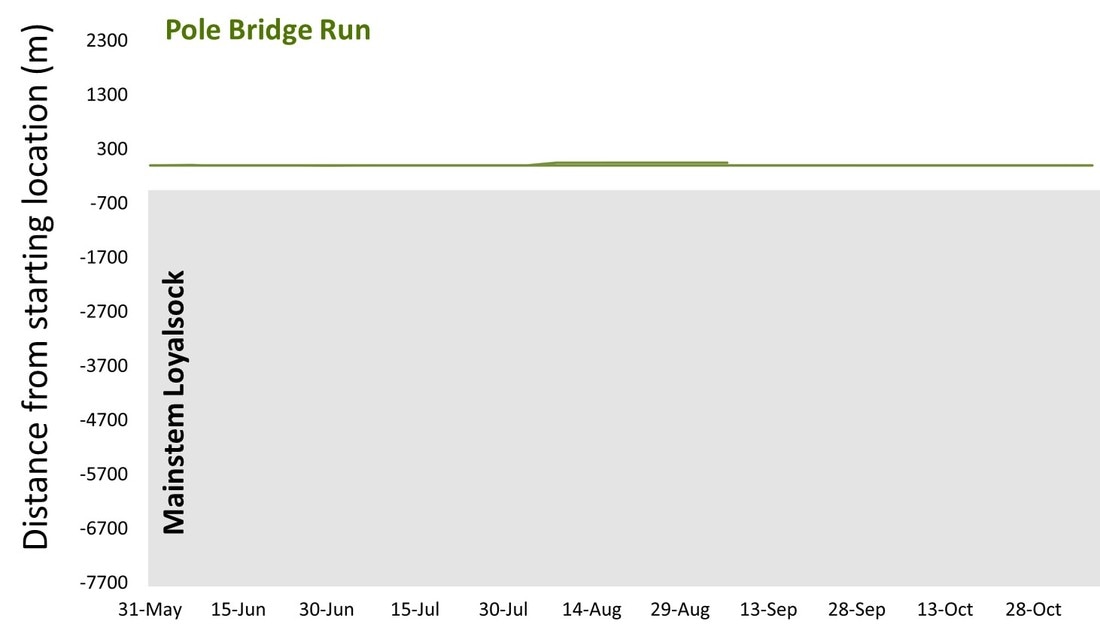
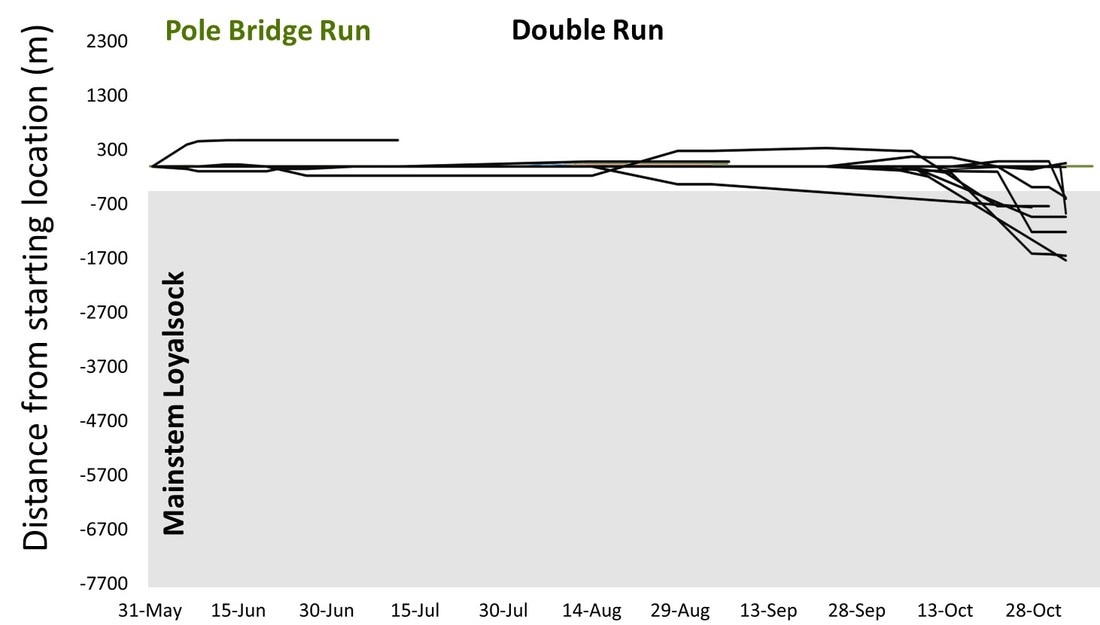
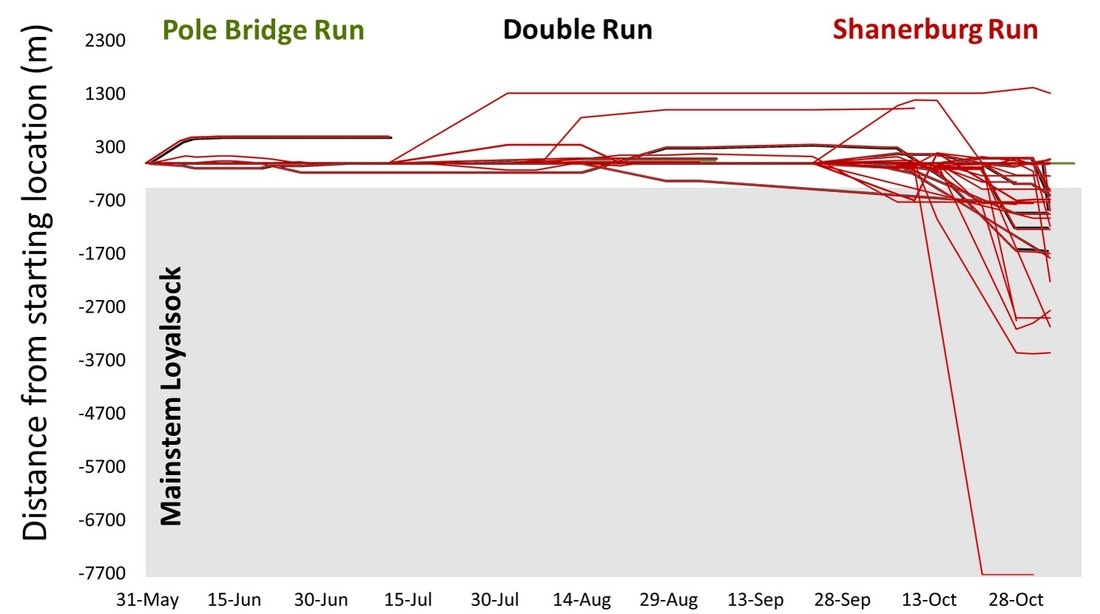
Are fish moving between headwaters and mainstems (like we see in Loyalsock) a true life history variant? If so, how cool would that be? We’re a really long way from being able to say anything about behavioral variation in populations, but I will say that we aren’t the first study to document such dramatic differences in individual behavior. So, there’s support out there for the idea. But, going back to the main question, how do our data compare to other brook trout population genetics studies? That’s an easy, albeit unsatisfactory, answer. Previous studies showed a lot of variation, and our study shows a lot of variation. So, Loyalsock Creek, as a whole, is not more or less isolated than we would expect given other studies. When we zoom in we see patterns were certain sites do seem oddly disconnected, and others more connected than we would have thought. And, seeing if we can explain that variation is going to be what makes our study so interesting. Okay, I admit it. I slacked this week on blog post duties. February has already proved chaotic with personal and work-related travel, and the rest of the month will be much of the same. Seems lately I’m treading water just to stay behind. But, that’s the way it goes sometimes. Thankfully, thought last week’s travel started quite stressful, it ended up being fun. The entire Wagner lab rarely gets together aside from occasional sampling trips to Loyalsock Creek. But, last week we all traveled to California, PA for a joint meeting between the West Virginia and Pennsylvania Chapters of the American Fisheries Society. We represented the lab well with Megan Schall receiving the award for Best Student Presentation and myself receiving the Cooper Award for exemplary fisheries work by a student member. It was also the first conference that Tyler Thompson and Danielle Massie attended, and they did a great job fielding questions about their posters. So, not only did the four of us get a chance to hang out outside of the office, but we did some great science as well. The stressful part of the week came before we left. I’ve known for over a month that I was going to present results of our telemetry study at this meeting. Yet, even 24 hours before we left town, I still had no real data. I’ve said before that the telemetry dataset is fairly messy and complex, and it wasn’t really clear to me what numbers I wanted to present. All along I assumed I would just describe general trends in the data, but, the more I put together the presentation, the more it become obvious that some visuals were needed. So, I started measuring fish movement. By hand. And kept measuring fish movement right up until the point we got in the car to leave. Sure, there are programs that will automate this process, and I intend to use them very soon. But, it takes a long time to get those programs to run and I was quite confident I wouldn’t get results within a day. At least by hand I knew I would have presentable data. As an added bonus, as I was measuring the movements I was reminded how cool the dataset is. Sometimes when you’re in the thralls of data collection you forget that your results are actually interesting. What did I find in my whirlwind analysis? For starters, it confirmed that movement varied drastically across the three populations, and individuals vary considerably in their propensity to move. Movement data for each of the three major telemetry sties, Pole Bridge (green) Double (black), and Shanerburg (red) runs. You can see that fish rarely moved from their starting location, particularly in Pole Bridge, during summer. However, after spawning, fish in Double and Shanerburg runs made long-distance movements downstream and into the mainstem Loyalsock Creek. Second, in looking at the genetics, I found that movement is likely effective, meaning that at least some individuals that move into Loyalsock Creek eventually migrate to, and spawn in, tributaries outside of their home stream. This point is important because it indicates that movement into the mainstem is not random. Instead, fish that make long-distance dispersals into the mainstem are maintaining population and genetic connectivity, which we know are critical for long-term population survival. 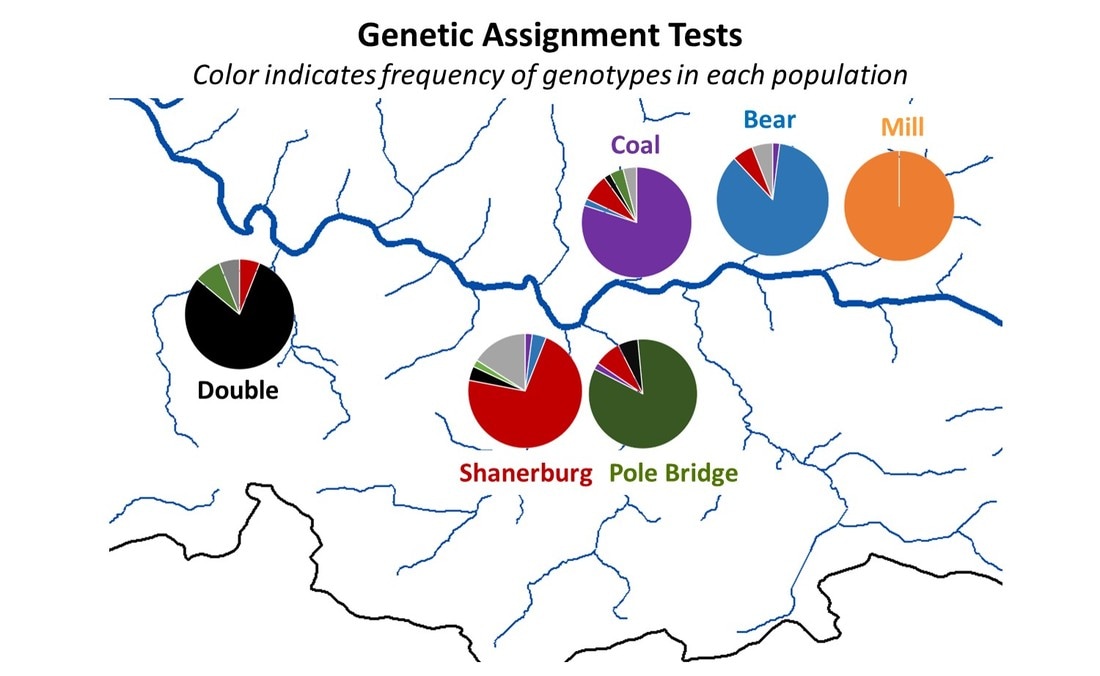 Results of genetic assignment tests where each pie chart represents the frequency of certain genes in each populations. For example, in Double Run, the majority of fish have genes consistent with Double Run being their home stream, but other fish have genes consistent with an origin in Shanerburg (red). Pole Bridge (green), and areas outside the study (grey). Similarly, Shanerburg Run is comprised of fish from Double, Pole Bridge, Bear, Coal, and sites outside of the study area. Taken together, this indicates that a lot of fish move between these populations. Pretty cool for a day of analysis, right?
Next week I’m giving the same presentation at the Virginia Chapter of the American Fisheries Society. I attended Virginia AFS for seven years before moving to Pennsylvania, so my motives for going are mostly personal. But, though this crowd is unlikely to care about the current conservation status of Loyalsock Creek, they likely will find the data of considerable interest to the conservation of their own trout populations. I’m just glad I don’t have to analyze the data again for that talk. 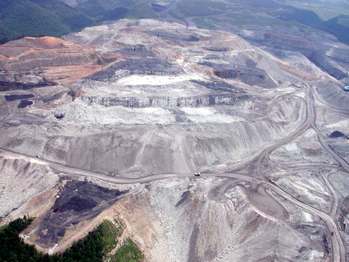 Typical landscape of a mountaintop coal removal project. Just think of all the sediment from that site that likely entered a stream bed. Photo from ohvec.org Typical landscape of a mountaintop coal removal project. Just think of all the sediment from that site that likely entered a stream bed. Photo from ohvec.org It’s no doubt that the current political climate has many natural resource professionals on edge. Jobs are being cut, budgets are dwindling, and some of us are even questioning whether we will be able to release the results of research we have dedicated our lives to- research that is vital to heal the wounds that remain after centuries of environmental neglect. Believe it or not, that is not a political statement. It is almost un-American how little I keep up with current events, especially in politics. And, I try to not let my opinions be swayed by my friends, family, social media, or fly-by-night news sources. To do politics “right” requires a lot of fact checking and research, and so I don’t have all the information necessary to form an opinion about many hot topic issues. But, when politics enter your wheelhouse, you feel a little more compelled to speak out. Recently, the House of Representatives and the Senate (of which Republicans own the majority vote) both repealed a ruling from the Obama administration that prevented coal companies from dumping mining debris into streams. The regulation also required pre-mining assessment reports of the ecosystem and assurance that mining activities would cause no hydrological disturbance. The original law was meant, in large part, to regulate mountaintop removal mining where (as the name suggests) entire mountain tops are blown up to access coal seams that lie underneath. As you can imagine, this creates a lot of debris, and most commonly that debris was dumped into surrounding valleys. And, you know what else are in valleys? Streams. An estimated 2,000 miles of headwater streams have been buried by coal debris since the 1990s. 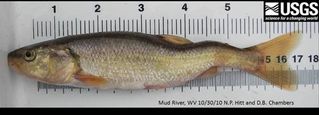 Typical characteristics of selenium poisoning in fish include spinal deformities. Photo from Than Hitt, USGS. Typical characteristics of selenium poisoning in fish include spinal deformities. Photo from Than Hitt, USGS. Debris is rarely dumped into rivers and larger streams, but rather the target is small, sometime intermittent headwaters. The streams, though tiny, hold some of the highest diversity of fish (including brook trout), macroinvertebrates, and amphibians in the United States. Many of these species are threatened or endangered, and are highly endemic; occupying only a few streams in the entire world. Yet, with a couple dumps of the backhoe, coal debris fills in valleys and completely removes entire streams (and the organisms in them) from the map. But, the effects are felt even downstream where water quality is degraded with high concentrations of heavy metals, high conductivity (a measure of the concentration of ions in the water), and levels of some chemicals (such as selenium) that are toxic to fish and even lethal to laboratory-tested animals. And, it’s not only aquatic life that is harmed as terrestrial species (like birds) that eat fish and macroinvertebrates are poisoned by toxins in their prey. Unfortunately, once mining debris is dumped into a valley, ecosystem recovery is very difficult to achieve. Even decades later, areas downstream of a dumping site have significantly fewer fish and macroinvertebrates than reference control reaches. Why Congress repealed this “dumping regulation” is debatable. Some believe it was an easy target, as it was passed in mid-December making it repealable under the Congressional Review Act (which, by the way, could soon cause many other newly inked regulations to be overturned). Others believe that the bill was unfair to coal companies and it made it significantly more expensive, and even impossible, to mine many sites adjacent to streams. If nothing else, most agreed that the wording of the regulation was hopelessly complex, leaving many to feel like it was nothing more than bureaucratic red tape. 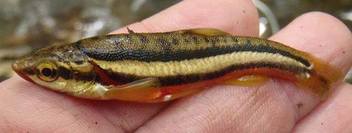 Chances to coal regulations could effectively eliminate populations of Clinch dace, a very rare minnow found in only a handful of streams in Virginia. Chances to coal regulations could effectively eliminate populations of Clinch dace, a very rare minnow found in only a handful of streams in Virginia. News that the dumping regulation was being repealed had many rejoicing at the thought of a resurgence of big coal, particularly in Virginia, West Virginia, and Kentucky where coal mining was once much more prevalent than today. I’m one of the first to recognize that human-environment interactions are give and take. Sometimes situations arise were we can’t prevent negative impacts on the environment if we are to complete a project that, ultimately, is for human good.
But, reckless coal mining, the type of coal mining that will be permissible if the dumping regulation is repealed, is not one. In my former life I was a Master’s student at Virginia Tech studying an undescribed species of minnow found almost exclusively in watersheds with mining activity. Brought to the area to study fish, I found myself equally interested in the social dynamics of mining. These boom-and-bust towns are shells of their former selves, and hidden beneath the overgrown shrubs and collapsing buildings are signs of a once vibrant community. Remaining families depend almost entirely on coal to put food on their tables, and in recent years lucrative positions in mining have become increasingly rare. These families are proud of their heritage of hard work and dedication. At the same time, they are praying for assistance, and I can only image that repeal of the dumping regulation (and several other regulations pertaining to natural resource extraction) has many excited about the potential for revitalization and new, better career opportunities. A “way out” of hard times that have fallen. I cannot pretend to know what is best for these coal communities. Coal is a culture, one with which I cannot relate. Nor can I predict with any certainty the economic ramifications that repeal of the dumping regulation could have. But, I do know that the idea of coal saving these communities has been oversold. Though many believe declines in coal production are the result of more stringent regulations (like the dumping regulation) the truth is that it has been outpriced by natural gas and phased out by a trend towards using more sustainable energy sources. Further, while repeal of mining regulations could increase production, it will also likely result in increased prevalence of illnesses and cancers that are common in coal communities when drinking water becomes contaminated. So the more likely reality, the reality that seems hidden from many discussions recently, is that increased, less regulated coal mining will result in short-term increases in coal production, and much longer-term decreases to human and ecosystem health. As of today, the repeal of the dumping regulation awaits President Trump’s signature. If he signs, as he is expected to do, decades of restoration and reclamation and improvements to rural living conditions, will be threatened. If you want to read more about the effects of debris dumping, click here With genetic analyses mostly complete, it was time to step back and look at the big picture of what the data were telling us. And, what it said was that there might be considerable stocking influence in some populations. So, we need to first figure out which hatcheries are stocking in Loyalsock Creek, sample those fish, and then re-run analyses to see how much hatchery stocks influence natural populations. So, road block..at least for now. This discussion made me realize another page on this website could use a little updating. Specifically, under the "Research" tab, I have information that answers some important questions that often come up in discussions with anglers and citizens about trout and fish management. So, this week I added to that list and answered the question "how do hatcheries influence brook trout?" Click HERE to go to that page.  One influence of hatcheries: really large, nonnative fish that are great for taking pictures with.  My first field project wasn't as a technician, but I quickly learned what sets certain crew members apart from others. Here, Arba does his part to model field equipment (and keep everyone laughing). My first field project wasn't as a technician, but I quickly learned what sets certain crew members apart from others. Here, Arba does his part to model field equipment (and keep everyone laughing). For many field biologists, the start of a new year means that it’s time to get serious about summer field season preparation. There are supplies to order, permits to submit, and, almost certainly, technicians to hire. In fact, I have probably seen close to 50 advertisements for summer technician jobs cross my email this week. Tis’ the season. If you are currently an undergraduate student, have recently graduated, or might be thinking about making a career change, these seasonal technician jobs are exactly what you should be looking for. They generally only span the summer, so they won’t interfere with classes. And, if you hate the work, you won’t be forced to do it longer than three months. In short, it’s a low-risk way for you to test the waters on a possible career path and gain experience that will move you up in the applicant pool for future jobs, all while getting paid. But, don’t let the temporary status of the job fool you. Many (most?) biologists got their first “break” in the field by excelling as a technician. While your contract might end in August, there are often opportunities for excellent technicians to continue working part-time after the semester starts, get invited to join other crews, or potentially even have their name on resulting publications. And, great technicians get great recommendation letters for awards, scholarships, jobs, and graduate school. I even know several people who were directly offered graduate positions after working as a technician for their advisor. So, what do I mean when I say “great” technician? It varies from job to job, and person to person, but I’ve tried to come up with a list of the top 10 things you can to impress your boss as a technician. 1. Be on time. And, by ‘on time’, I really mean at least 10 minutes early. This is especially true if you are doing field work, which requires a lot of packing, hauling, and planning. Supervisors try to prepare all of that in advance, but only rarely does everything go as planned. So, make a habit of showing up early and offering to help. Ten minutes of unpaid time before the start of the day can go a long way. And, it goes without saying, don’t make a habit of being late. 2. Ask questions. If you’re uncertain about what you should be doing, ask. If you want to make sure a number is right, ask. I would much rather answer the same question 50 times and know you are collecting the data correctly than months later find out it was all done wrong (and trust me, someone always finds out eventually). Likewise, if you want to know more about the research project or why the data are being collected, ask. No question is stupid. Personally, I think one of the most impressive things a volunteer or technician can do is ask questions about why I am doing my research. It tells me they are engaged in the science behind the effort, which generally means they are more invested in collecting good data and are interested in the project beyond just the paycheck. 3. Read my mind. Seriously. I know I just harped on asking questions, but eventually you should be able to think one step ahead of your supervisor and do things without being asked. If you go to five sites and the first thing you’re told to do at every site is to fill a bucket with water, then by the sixth site you should hop out of the car and immediately go get water. Take initiative, be proactive, and step-in where you’re needed. The best field crews are those where everyone knows what the goal is for the day and can fluidly, without much direction, work together to achieve those goals. It takes some time to settle into the routine, but, once you do, the work goes a lot faster and the day is much more relaxed and enjoyable. 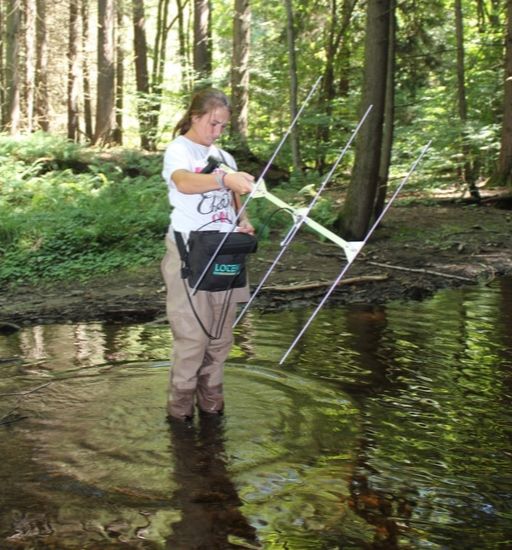 Savannah despised telemetry tracking. But, she volunteered to do a section of stream every day to give us both a break from the monotony. And, she was just as stressed as I was all summer whenever things went wrong. 4. Keep your head in the game. Technician work is often not the most fun or exciting work. It’s data entry, repetitive habitat measurements, video analysis, etc.- we’ve all been there, we can all sympathize with how endless the days feel. To make the work bearable, you’ll need to find something to keep yourself mentally engaged with the project. Maybe you can listen to music, talk with other crew members, volunteer for other projects, or just enjoy the fact you’re working outside. Do whatever it takes. People that can stick with the very monotonous jobs are often the people that I rank highest on my list because I know they are interested in the job beyond just the fun stuff. 5. Don’t be disrespectful. While true for all jobs, this tip is geared specifically towards technicians who will be working with a graduate student. The age gap may be small, and in some instances you, as the technician, may actually have more experience than the graduate student. But, don’t suggest you are more knowledgeable about a topic, try to dictate a schedule, or redesign their field study (this may seem ridiculous, but I’ve heard this happen on many occasions, particularly with Master’s students and their technicians). You can, and should, offer a suggestion about a better method or a way to save time. But, at the end of the day, this person is your boss and there’s probably a very good reason behind their study design and methods. Relatedly, if you’re working with a new graduate student, expect some degree of chaos. Leading a field crew and collecting data on your own is hard and stressful. They won’t always have a clear vision of what’s going on, but you can help them tremendously if you try to keep the project organized. 6. Be flexible. Sorry in advance. I probably don’t know what your hours are going to be, but it very likely will include night and weekends, and almost certainly over 40 hours a week. Sometimes you won’t get paid for all of those hours. I’ll cancel work within minutes notice because of rain, and sometimes ask you to live in sub-par housing. This entire profession is about being flexible and adaptable, and the more you are willing to roll with the punches the more you’ll impress your supervisor and be given more opportunities. Talk about flexible. Last year my technicians were hired with the promise of doing laboratory genetics work. Needless to say they never touched a lab. Here, Nate tries to unlock the door after locking his keeps in the car just outside of cell phone service (we ended up breaking the window) and Laurel huddles under a bucket in a rainstorm. A shame they don't actually like fish, because I would rehire them in a heartbeat. 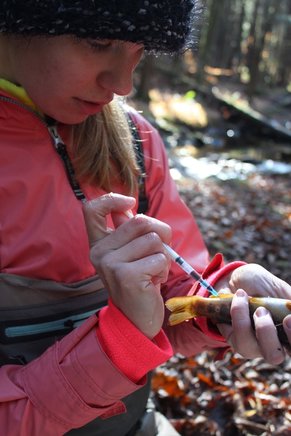 Though never formally my technician, Danielle has worked with me on several projects. She is one of the most driven people I've met, and last time we were in the field I had her try some new skills. Here, she learns drawing blood on fish takes a lot of practice. Though never formally my technician, Danielle has worked with me on several projects. She is one of the most driven people I've met, and last time we were in the field I had her try some new skills. Here, she learns drawing blood on fish takes a lot of practice. 7. Hustle. Field work is all about packing 20 hours of work into a 10 hour day. That means there’s not much time for breaks (my crews are notorious for shocking with one hand and eating with the other), small talk, or correcting mistakes. Move purposefully between tasks. Be efficient. Be mindful. Stay focused. At the same time, make sure you aren’t sacrificing the quality of your work by trying to rush through it. 8. Volunteer to do the dirty work. Carry the heavy stuff, run back to the truck, stay late to prepare for tomorrow. Your supervisor can, and should, do some of this. But, it makes them infinitely happier if there is someone willing to carry the load. 9. Be willing to try new things. Yes, the average day will be too busy for your supervisor to show you a new skill. But, if your supervisor can tell you are committed and invested (because you have exceeded expectations in the areas above), they will find time. The whole point of a technician job is to gain experience, and you won’t do that by sitting on the sidelines. And, don’t worry about being good at everything when you first try it. Everyone starts somewhere, and the best place to learn is when someone is there to help teach you. By the time you start graduate school or take a full-time biologist job, your boss will assume you have certain skills that you can learn as a technician. 10. Have fun. There’s a chance you won’t fall in love with the work you do as a technician (but, you might!). And, you may be signing up for three months of bug bites, sunburns, sweat, and exhaustion. You need to find something to keep the days entertaining and fun. Luckily, you’ll probably be joining a crew of people who have done summer field work long enough that they’ve gone just a little bit crazy. Follow their lead, prepare to learn and work hard, and just have fun. In a few years you’ll look back with fond memories and great stories. I tried to limit my list to things anyone, regardless of background and experience, can do to be a good technician. If you want bonus points, I would suggest you up your knowledge of species identification for the system you work on, know your way around a toolbox, be comfortable working in remote locations, and try to get a job as early in your undergraduate career as possible. Starting early means you have more opportunities to gain experience, and more chances for me to re-hire you on my crew. If you think I’ve missed something, leave a comment below!  Can't forget Dan! After several years of a technician work, he's got more background training than many graduate students.  Beau, aka "snow pig", after a hard day of plowing show with his snout. Beau, aka "snow pig", after a hard day of plowing show with his snout. I’m in Virginia this weekend where I’m currently watching snow accumulate and my little snow pig root around. The ruler is reading around six inches, which in central Virginia is enough to lock the grids and cause chaos. Guess I’ll have to lounge on the couch all day. Shucks. Readers of my post from last week may recall mention of some genetics models my computer was slowly cranking out. Yep- those are still running. But it’s close to finishing and I think I can predict what the results are going to be. It’s potentially really interesting, but, I don’t want to report any findings, no matter how preliminary, until I’m confident they can hold at least a little weight. Plus, I’m meeting with some collaborators next week and I think they will recommend a few tweaks to the analysis that will help clarify some oddities and rule out other possibilities. But, soon. Promise. In the meantime, I’ve started the early stages of preparing the publication that will formally report the results from this study. This process is always a little daunting. It usually starts with a blank Word document, a lot of distractions and procrastination, and many frustrations as I try to find the perfect words and the perfect topics to tell the perfect story for the data. I call this stage “unproductive circling,” and for me it can last for days. Then, I break down and just start typing. The resulting text is usually a horrible mess of incomplete thoughts, poor grammar, cuss words, and confusion. But, it stops my wheels from spinning so I can get traction and move forward. From there it’s all about refinement- reread, rewrite, reword. Over and over until the paper you were so excited about becomes utterly boring and dull. That’s when you know you’ve done your job correctly. 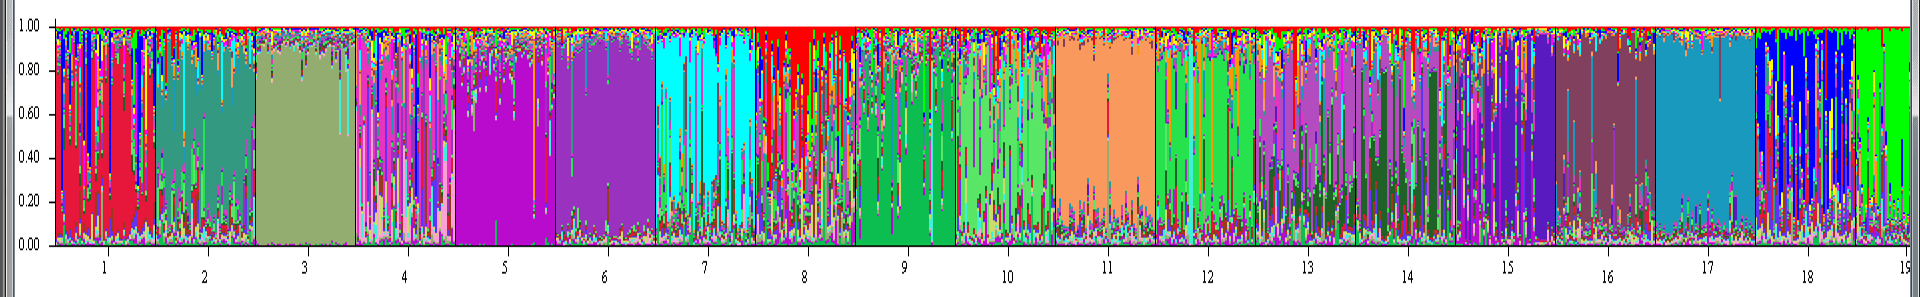 In case you're curious, this is an example output from the models that are running on my computer. I'll explain what these mean later, but for now, populations (numbered at the bottom) are more genetically distinct if they are shown as a solid block of color. So, for example population #3 is more genetically distinct than population #4, which COULD indicate that #3 is more isolated than #4. For those unfamiliar with scientific publications, it starts with an introduction. Usually, it’s a couple pages in length explaining what the scientific community already knows and justifying why your research project was needed to plug an information gap. Many writers will disagree, but I really enjoy writing introductions. There are millions of research articles out there, and it’s your job to figure out why your lone study is still important to science. It’s a messy thought exercise that ends in a succinct story. It’s as close as scientific writing gets to poetry. Much of this week was spent “circling.” I did all I could do to avoid writing, but I finally opened the blank Word document and stared. The problem I had was trying to decide what about my project was interesting. I know that sounds a little backwards. After all, shouldn’t you know your research is interesting before you do it? Yes, but that’s often not how research works. It’s only after it’s all done that you realize you got an unexpected result, or you collect data knowing it will be of interest to someone, but don’t know who that someone is until you’re nearly finished. So, I kept circling between two fundamental questions- is this study interesting because it’s brook trout, or is it interesting because it’s a genetics study of an aquatic organism? While the answer is both, it turns out that the impact of the study is probably further reaching if I stretch my mind beyond brook trout. Sure, the study will be important for brook trout management. But, can it tell us more about genetics in general? As I struggled with this question I do what I normally do- I started chatting with someone online. Luckily for me, my friend, Will, happened to be on. He studies genetics in many several wildlife species and knows far more about the topic that I ever hope to. He has been my go-to person during this process because he can give me insights into why something isn’t working or a next step. As we were talking he turns my attention back to a paper that has been sitting in my “to read” library for a long time. To be honest, there is nothing earth shattering about the paper. It describes ways organisms (and their genes) can distribute throughout streams. But, the paper is incredibly necessary because streams are a special type of habitat. Many genetics studies are conducted on terrestrial organisms that can disperse in any direction. But, aquatic organisms are restricted to streams (for at least part of their life) and so have very different controls on how, when, and where they can move. In some ways, you’d think streams make genetics models easier. Movement can only be up and down. But, that’s not entirely true for organisms like salamanders and macroinvertebrates that can fly or walk on land. Even for fish, which really are restricted to in-stream movements, models easily get confusing when you meet a tributary. Now movement isn’t just up and down, but the fish can pick any number of tributaries to occupy. Taken together, suffice to say streams quickly complicate gene models. But, this paper was helpful because it packages just about every possible way stream-dwelling organisms move into four models. (And, don’t get scared away by the term “model.” It this case a model doesn’t involved any complex math or equations, it’s just a possible scenario for how the world works.) The four models included:
 Imagine from Hughes et al. (full link to the paper below). In these images, imagine that there is a stream flowing north, and another flowing south. The dots represent populations where colors represent genetic similarity. Under the death valley model (A), there is no exchange of individuals between populations. For the stream hierarchy (B), organisms move within a waterrshed, but do not cross watershed boundaries (so genetics are similar for populations in the north flowing stream, but different between the north and south flowing stream). In the headwater model, organisms look for the next closest headwater, which is often in an adjacent watershed (so genes are shared among populations that are close in overland distance, regardless of watershed). And, in a widespread gene flow model, distance doesn't prevent movement and all populations are genetically similar. 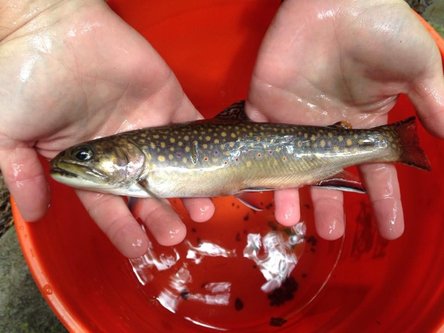 A beautiful brook trout, your prize for reading through all those genetic models and making it this far in this blog. A beautiful brook trout, your prize for reading through all those genetic models and making it this far in this blog. Conceptualized models, such as those described above, may not completely explain a single dataset, but it does help quickly put a dataset into perspective. We know that trout shouldn’t conform to the widespread gene flow or headwater models. Both of those require overland dispersal or very, very far stream distance dispersal.
Theoretically, trout should conform to the stream hierarchy model. We know that trout move, and they are more likely to move within their watershed than outside. And, previous studies have found evidence to support that trout genetics follow other requirements of the of a stream hierarchy model. But….(and here is why my study is special), most trout genetics studies are done at fairly small spatial scales. Usually 10 sites that are near one another and that are part of a larger watershed network. We studied 28 populations located throughout the Loyalsock Creek watershed. Near as I can tell, there isn’t a published study on brook trout that sampled as many fish from such a large distribution. So, hopefully, we can tease apart which genetics model most explains brook trout. Why does this matter? From a practical view, it can help in management. Management is most often applied at a watershed scale, but that’s not often the scale scientists do genetic studies. So, our gene data, which is arguably one of the most powerful tools we have, is not informative to our management efforts- at least not without a lot of assumptions. But, if we know that brook trout genes, at a watershed scale, tend to conform to one of the aforementioned models, then suddenly we can make more informative guesses (notice I say guesses) about how trout are moving in watersheds where we haven’t done a robust genetics analysis. From an ecological perspective, understanding which model brook trout conform to could be just the kind of interesting quirk ecologists dream about. From the telemetry data, we know brook trout move among tributaries. But, if they still conform to a death valley model, it could mean that they return back to their home tributaries. Brook trout, after all, are closely related to salmon. Or, it could be a mix of models, in which case we ask why some populations have adopted different behaviors that has then lead to distinctly different models of gene flow. I have a hunch as to what is going on. But, only time will truly tell… If you’re interested in reading the paper I described above, it can be found here. |
AuthorShannon White Archives
October 2018
Categories
All
|
The Troutlook
A brook trout Blog

 RSS Feed
Proudly powered by Weebly